
Thought Leadership & Sales Platform Case Study
Design Systems / Data Visualization
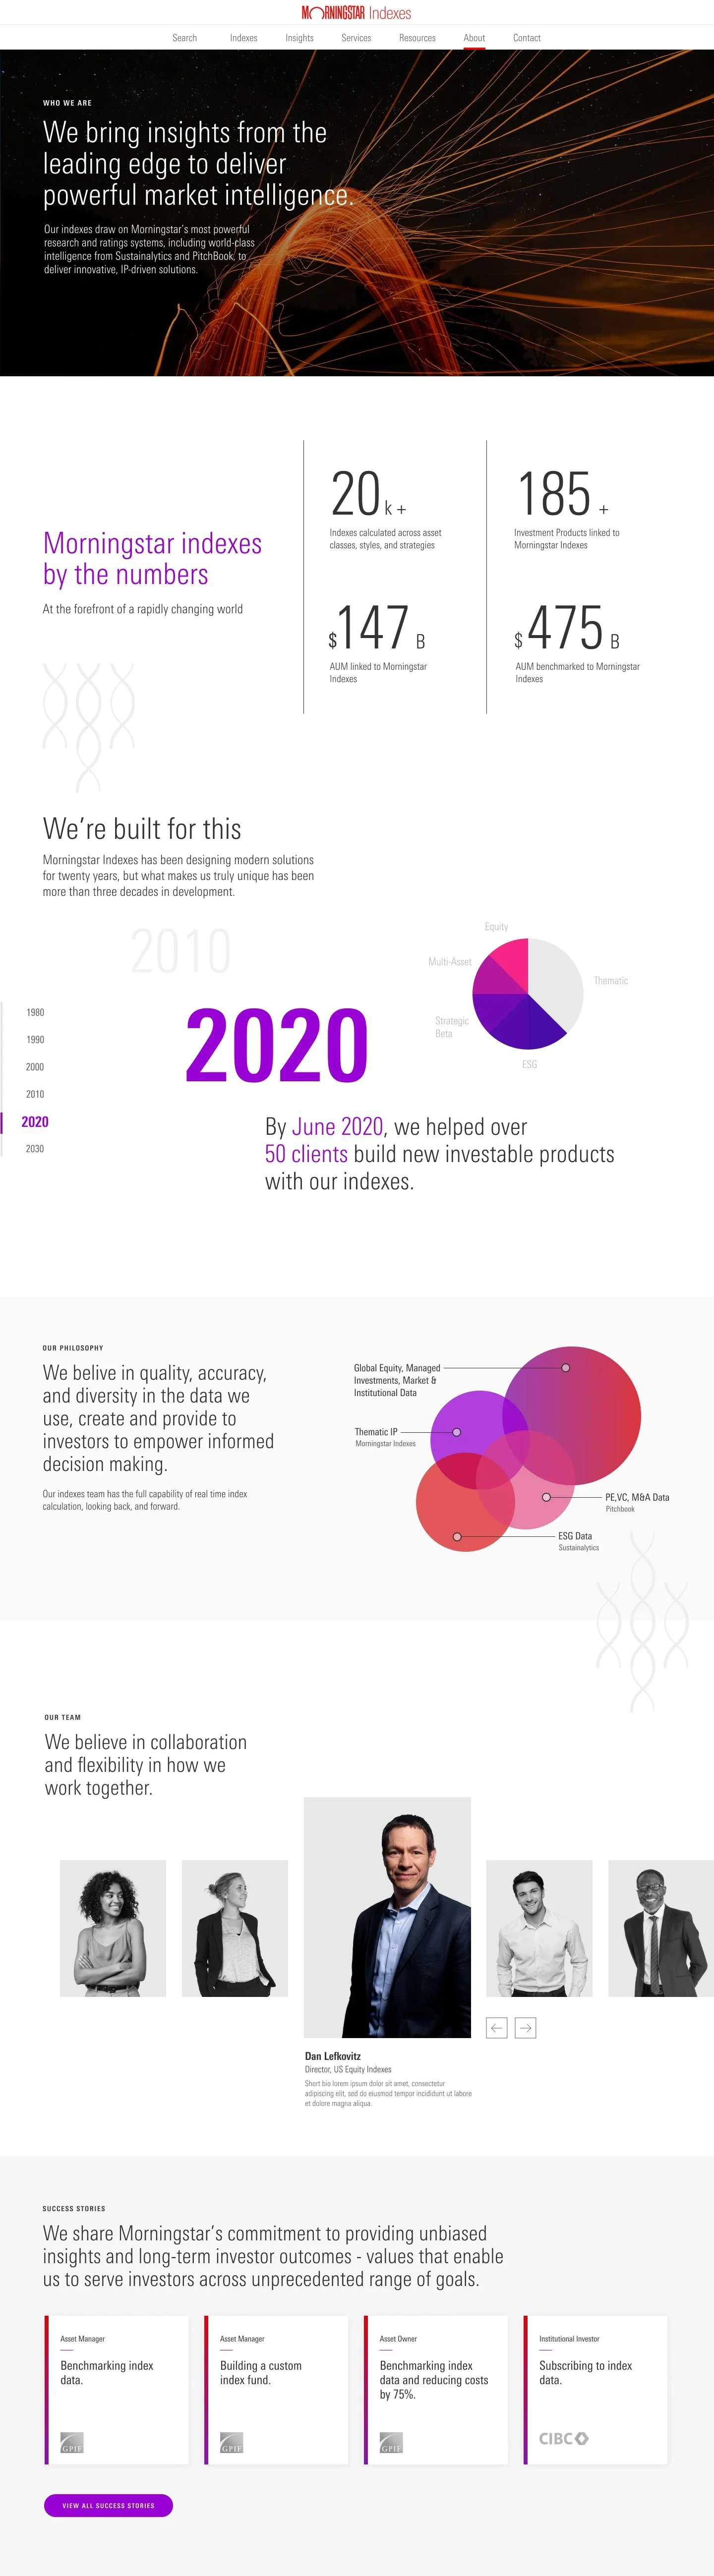
Morningstar Indexes provides the bedrock data for global ETFs and sustainable benchmarks. Despite their industry-leading position, their digital presence lacked a cohesive brand narrative and failed to showcase their deep analytical expertise. This initiative focused on bridge-building: connecting vast data resources with an intuitive, insights-driven experience for top-tier financial institutions.
Challenge & Opportunity
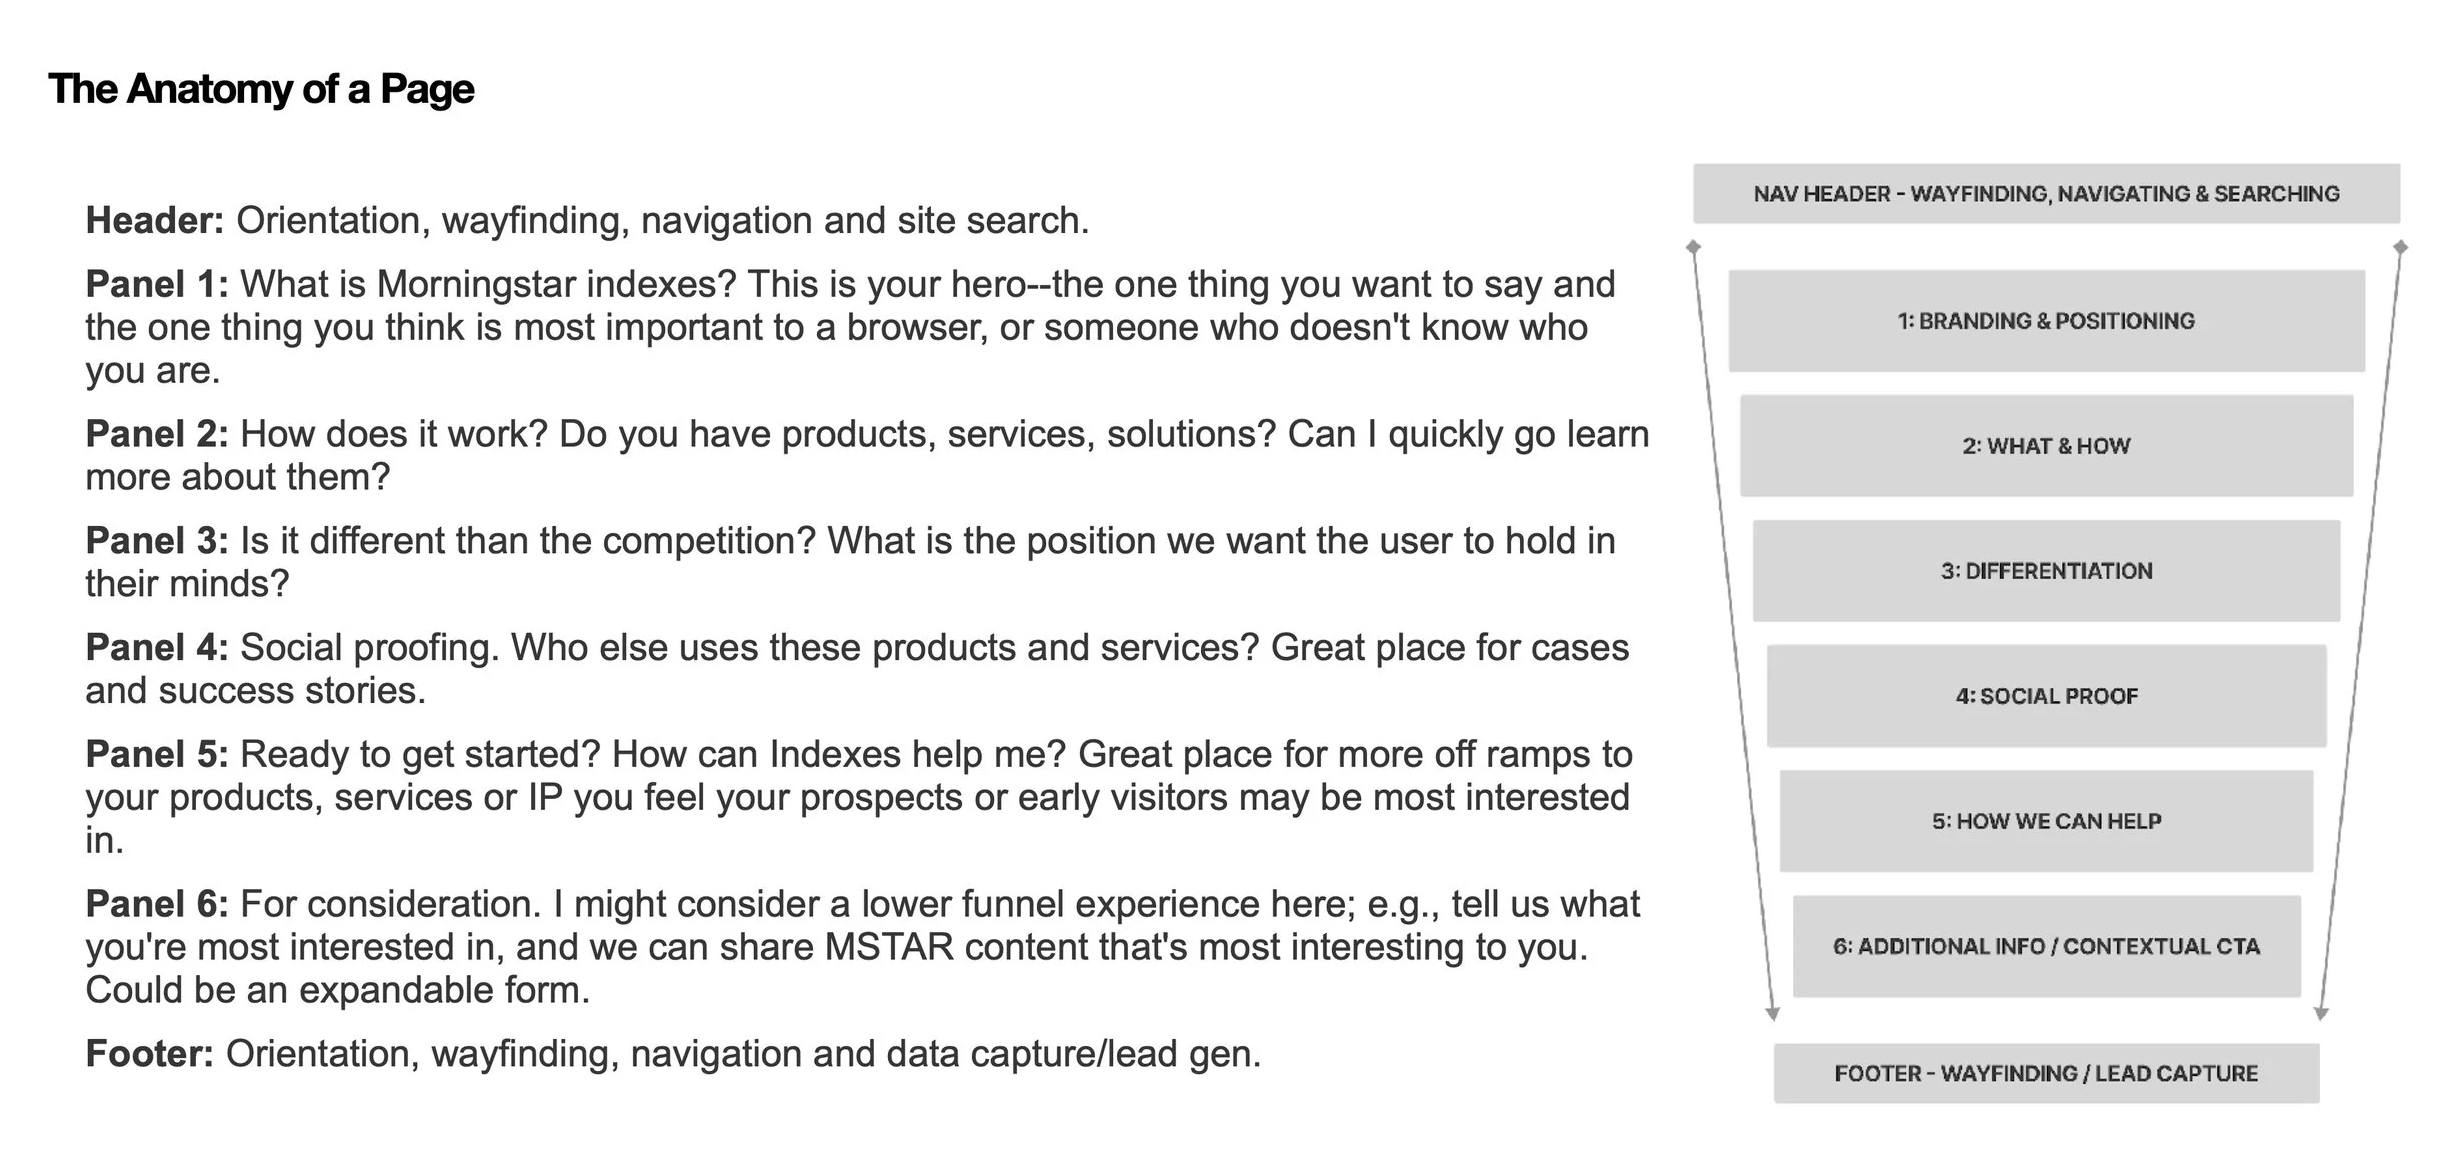
The existing digital presence failed to effectively communicate Morningstar’s industry authority. The site functioned as a fragmented data repository rather than a cohesive sales tool, making it difficult for users to navigate product lines or access high-value research. This disconnect presented a significant opportunity to elevate the brand and create a more intuitive experience for institutional investors.
Objective & Solution
The objective was to redesign the platform to bridge the gap between complex data and actionable insights. Our approach centered on a three-pillar UX strategy: amplifying the brand narrative, creating a dynamic hub for analyst research, and streamlining the path from product discovery to data acquisition.
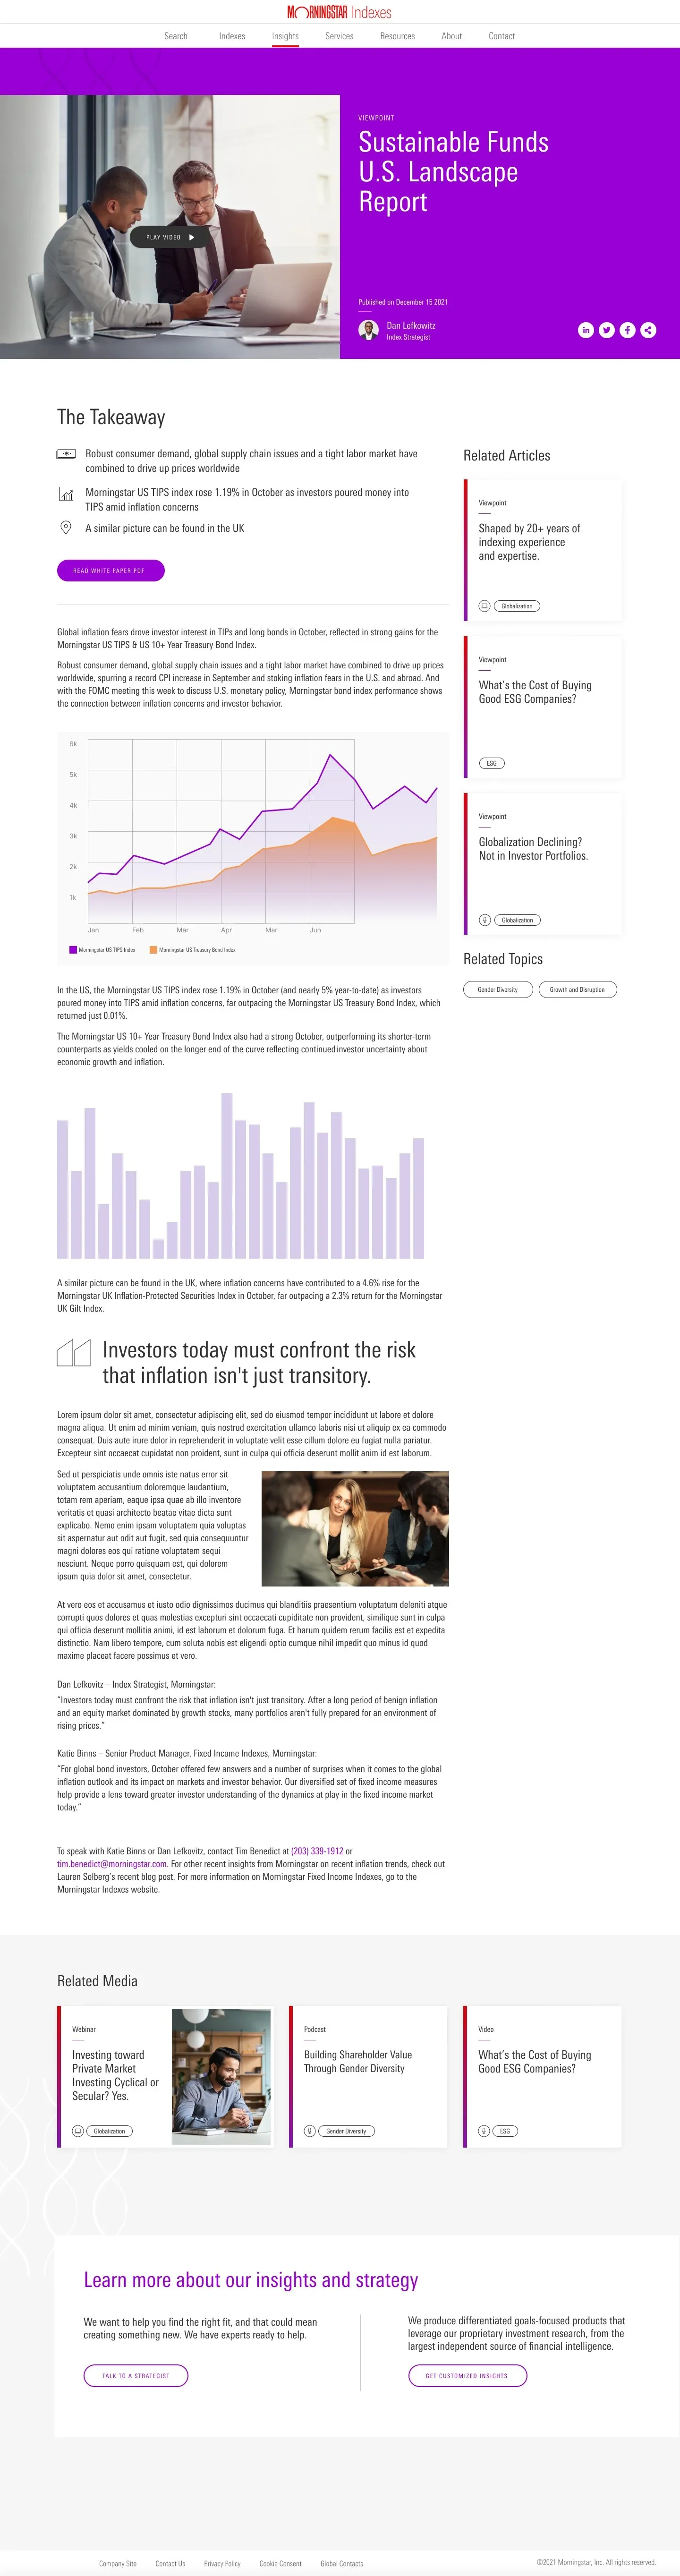
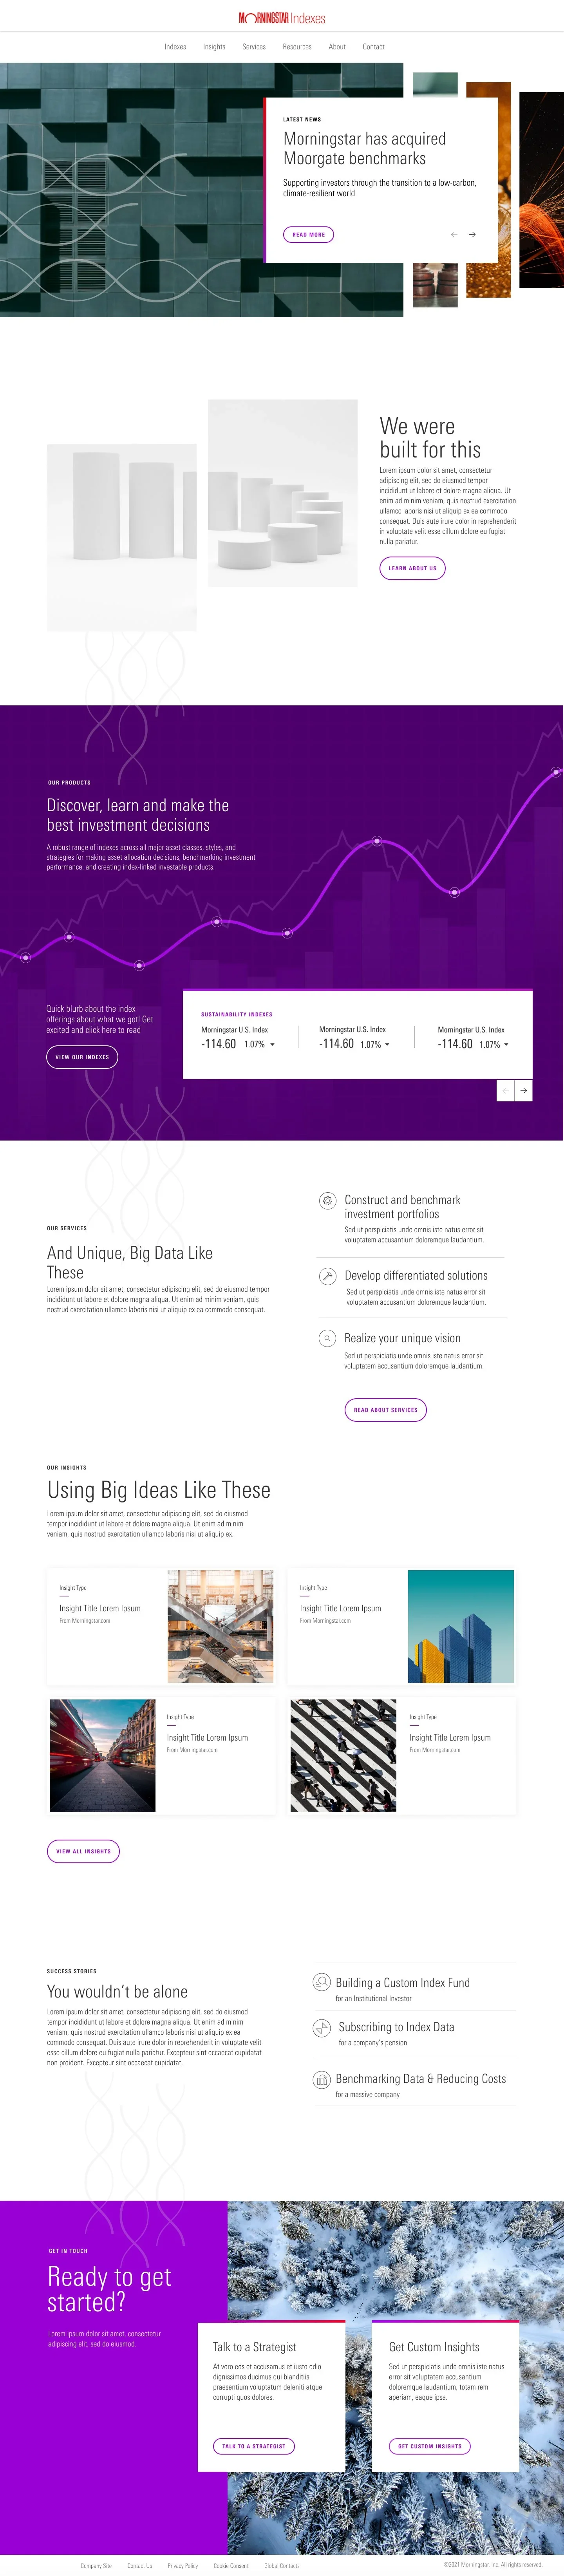
Thought Leadership Platform
Create a dedicated destination to showcase the insights of Morningstar’s analysts, transforming raw data into a compelling value proposition for prospective clients.
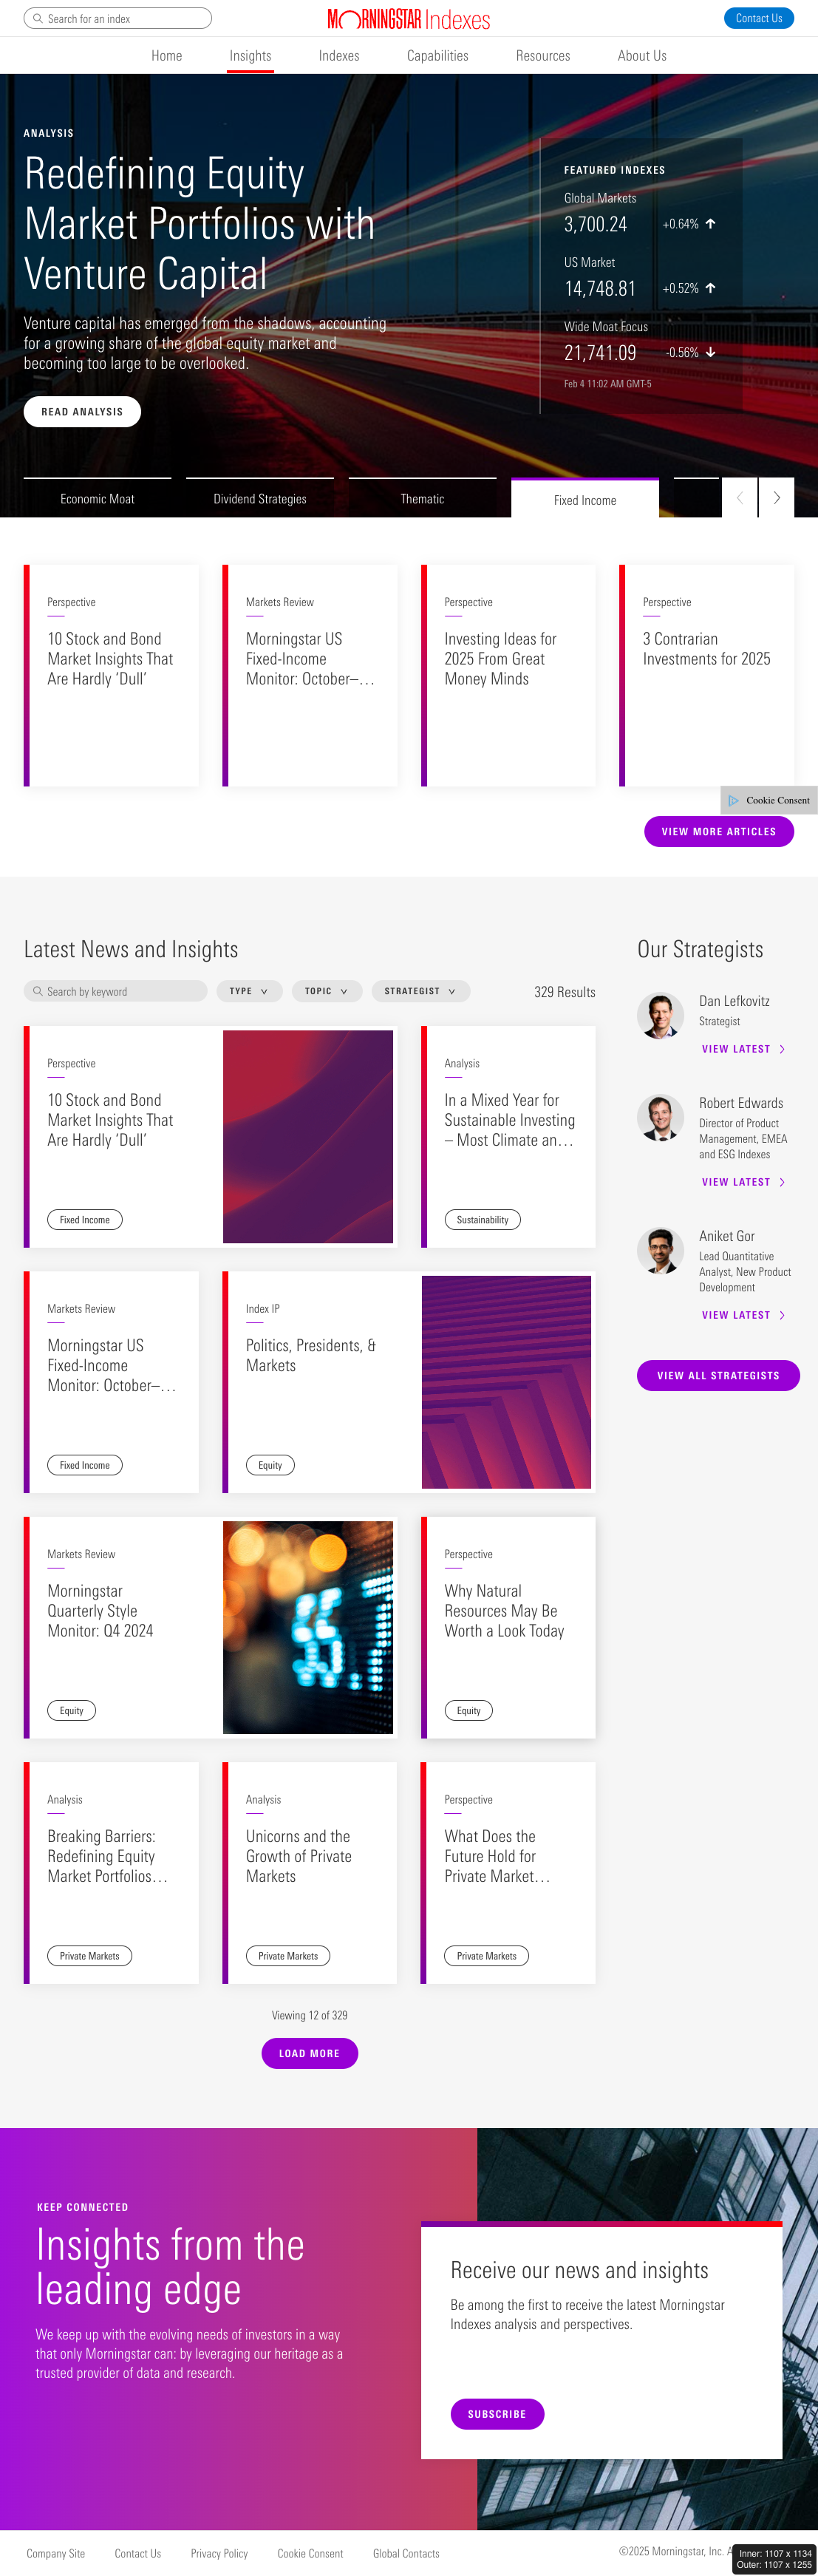
Dynamic Insight Hub
We implemented a CMS-driven platform that highlights timely research and industry trends, allowing analyst expertise to take center stage.
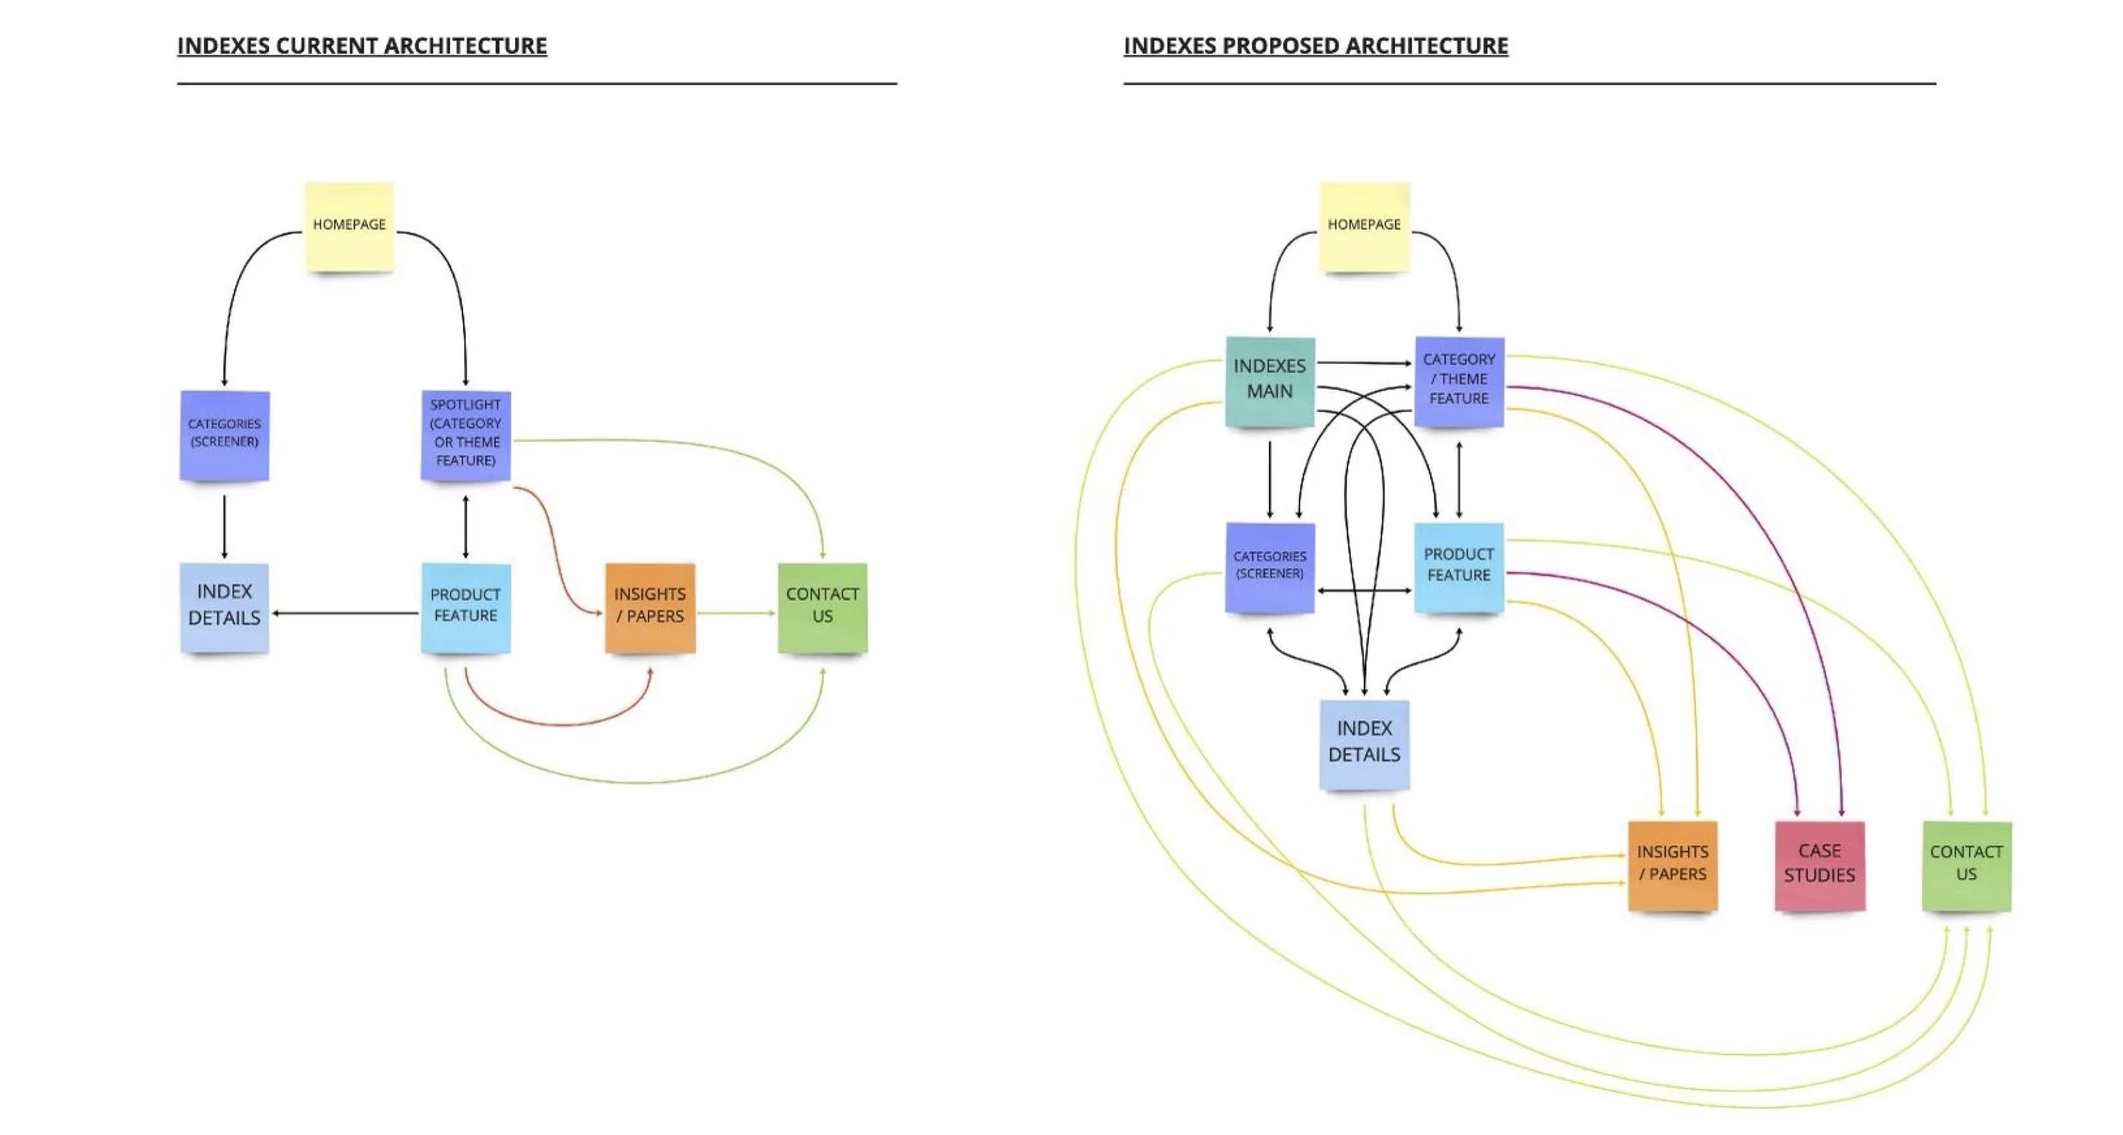
Streamlined Product Discovery
Redesigned the Information Architecture to simplify the journey from broad categories to deep-dive data, reducing navigational friction.
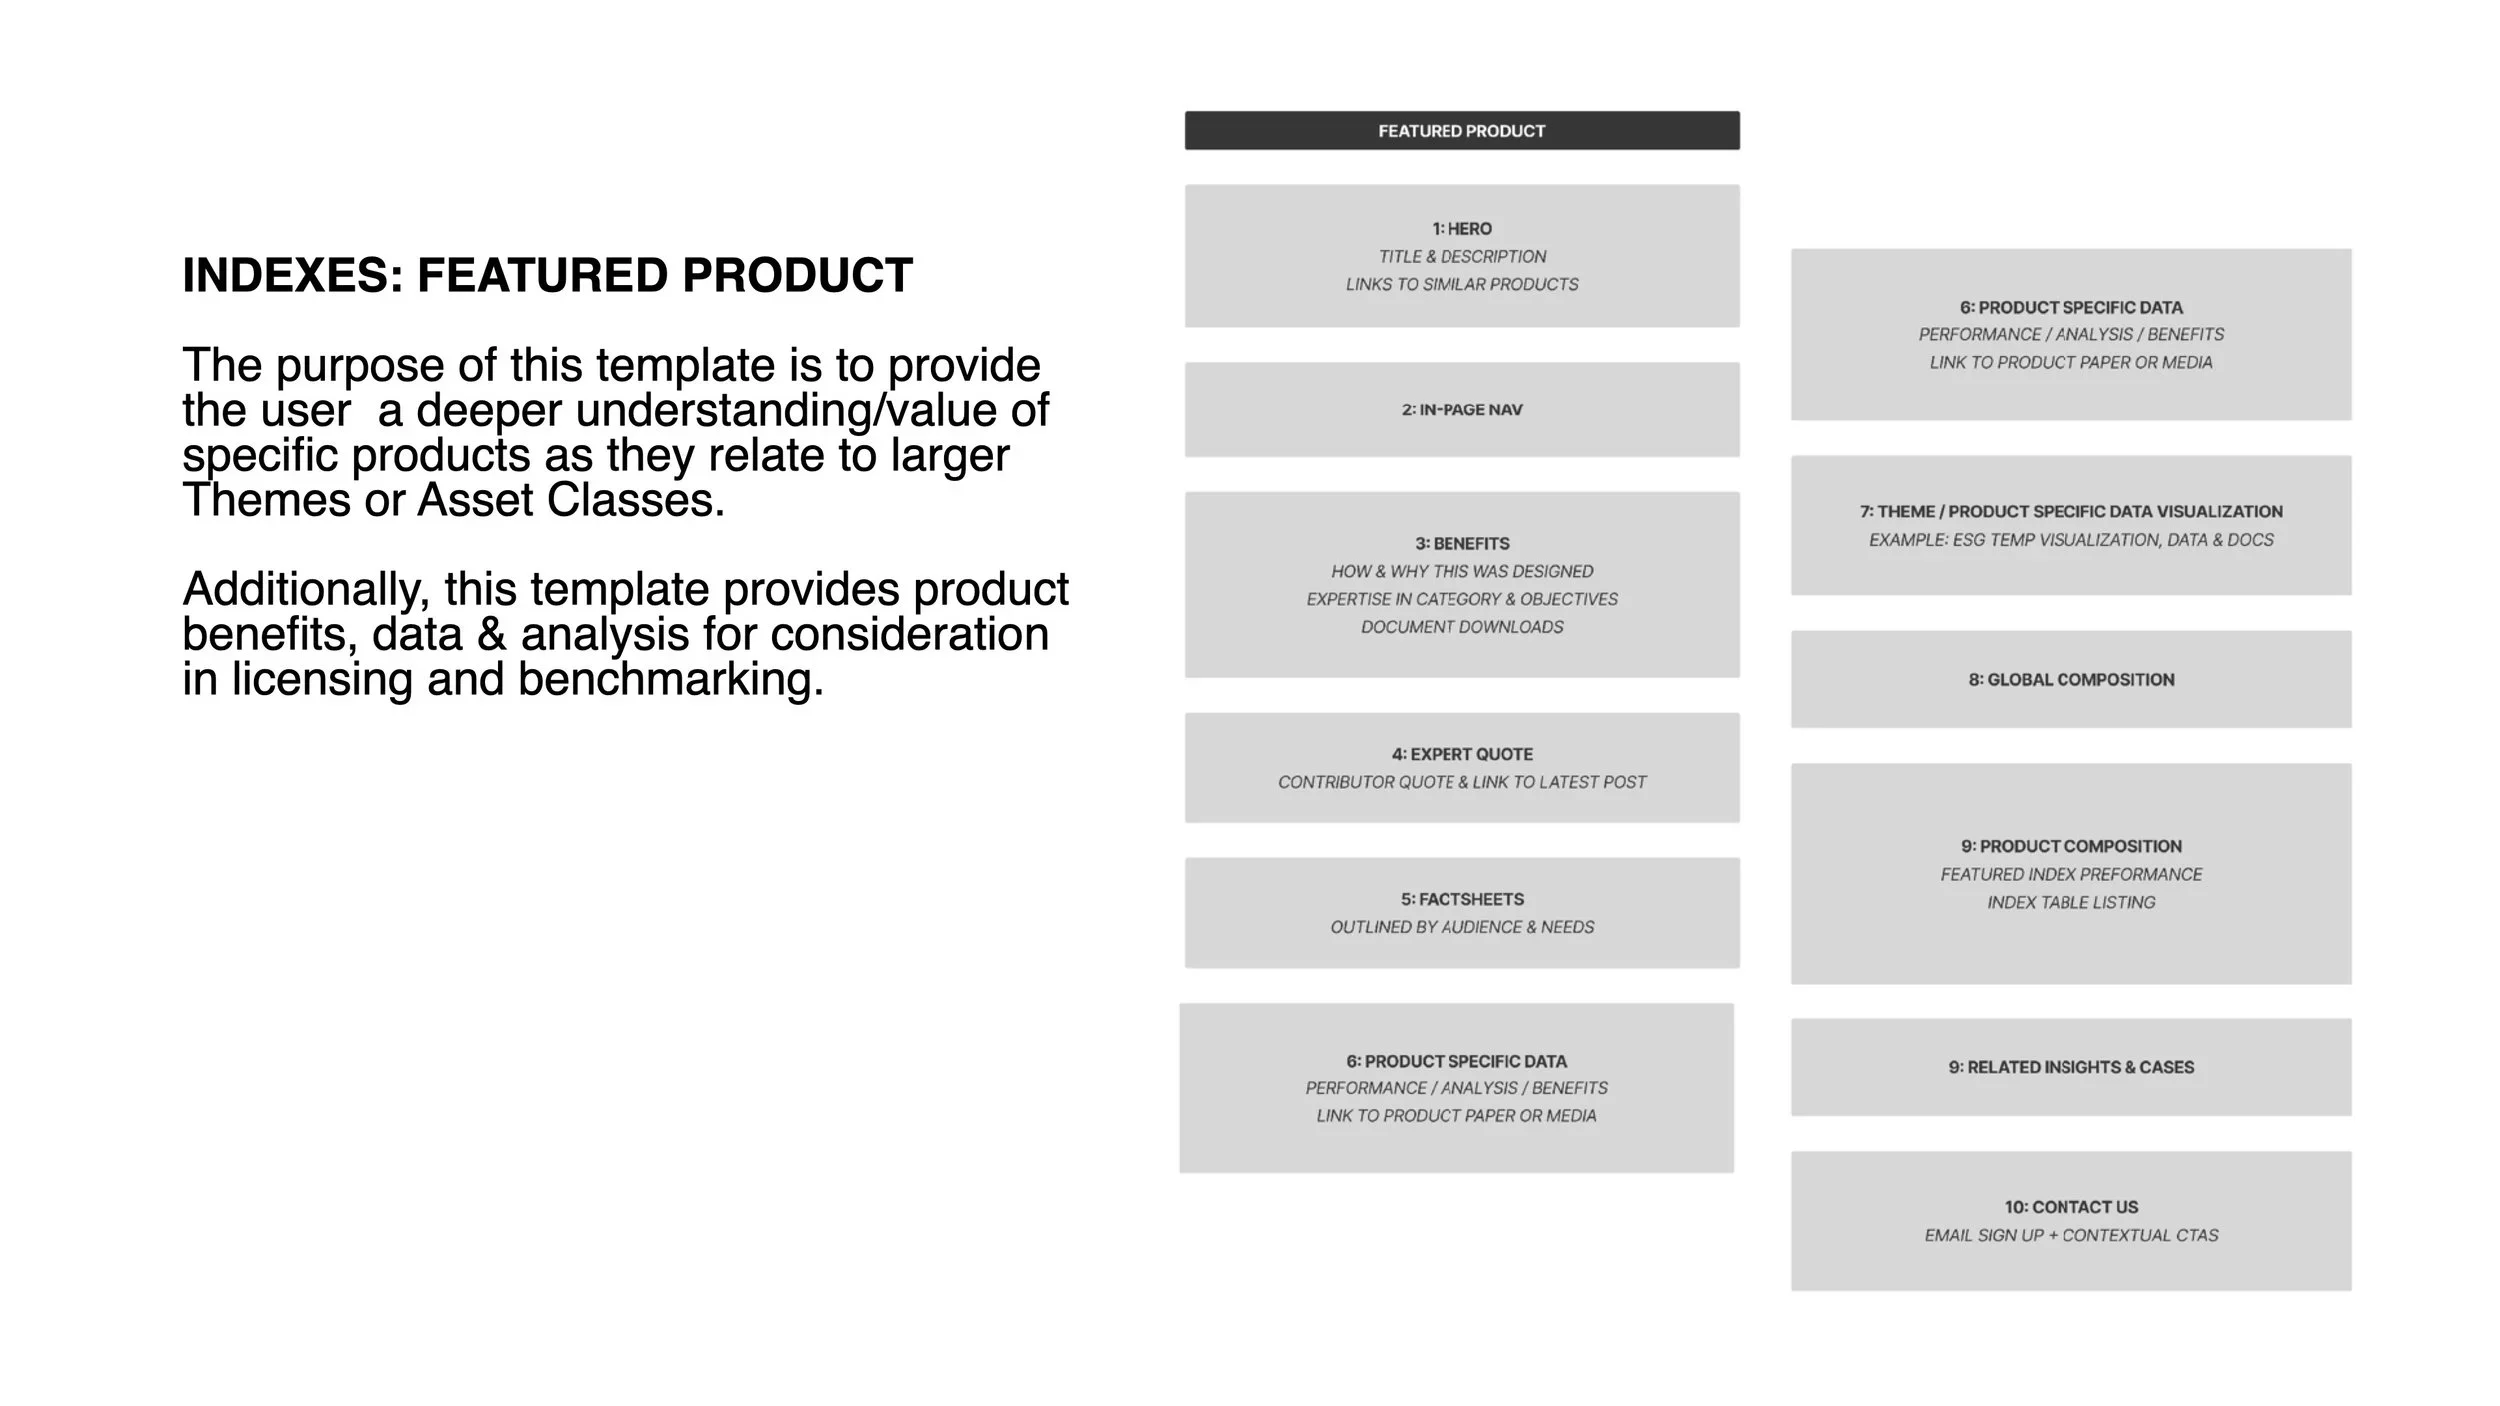
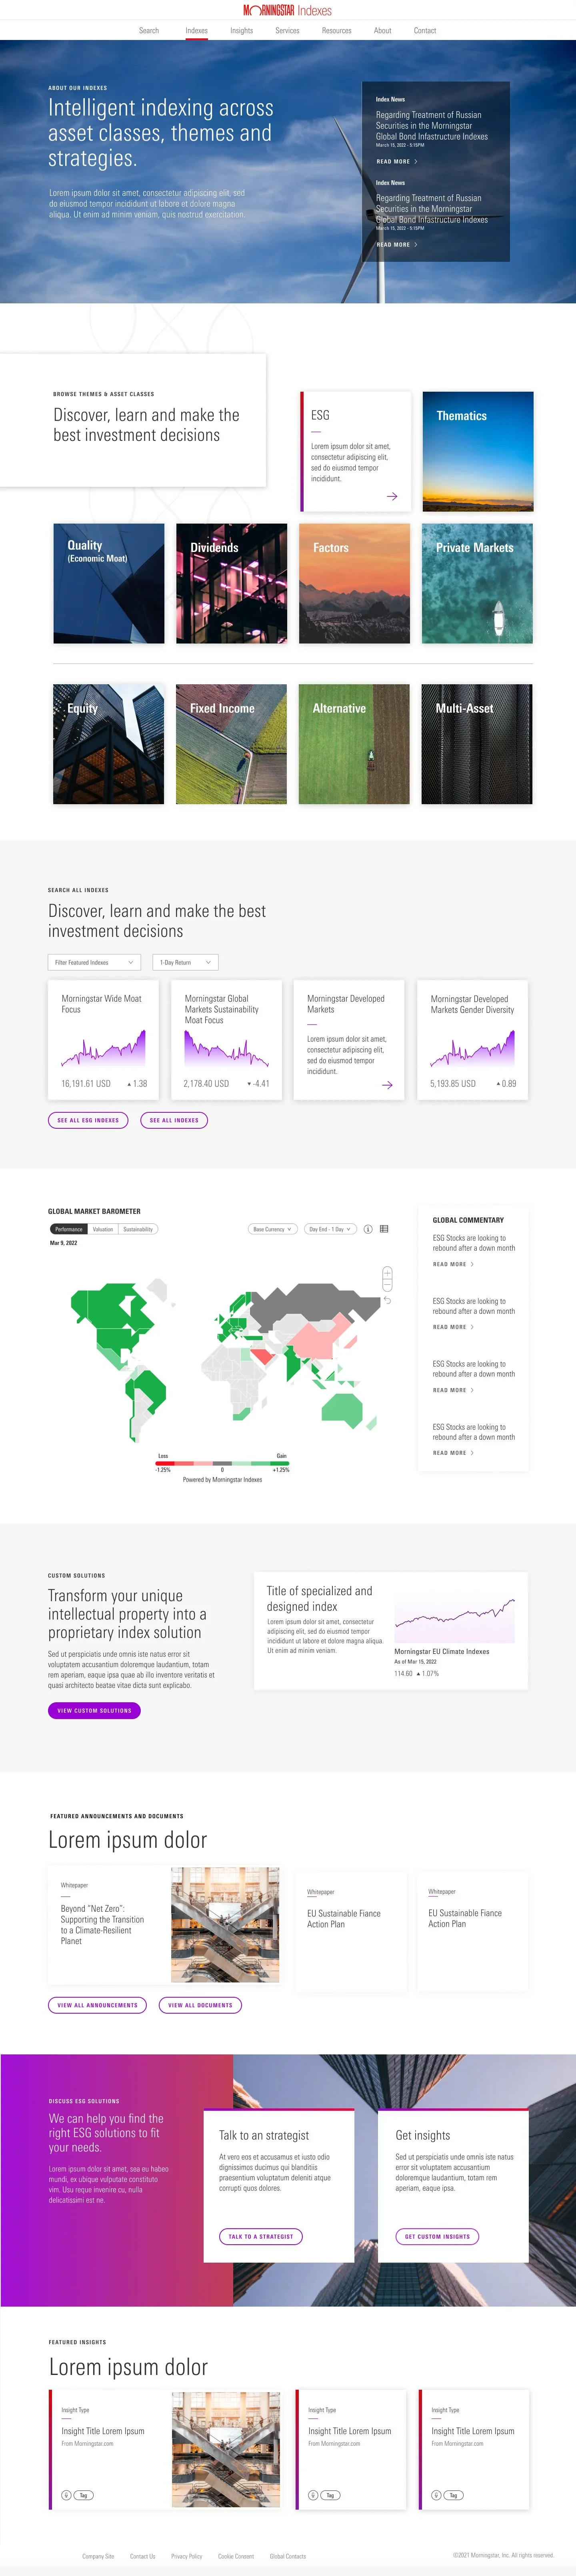
Streamlined Sales Experience
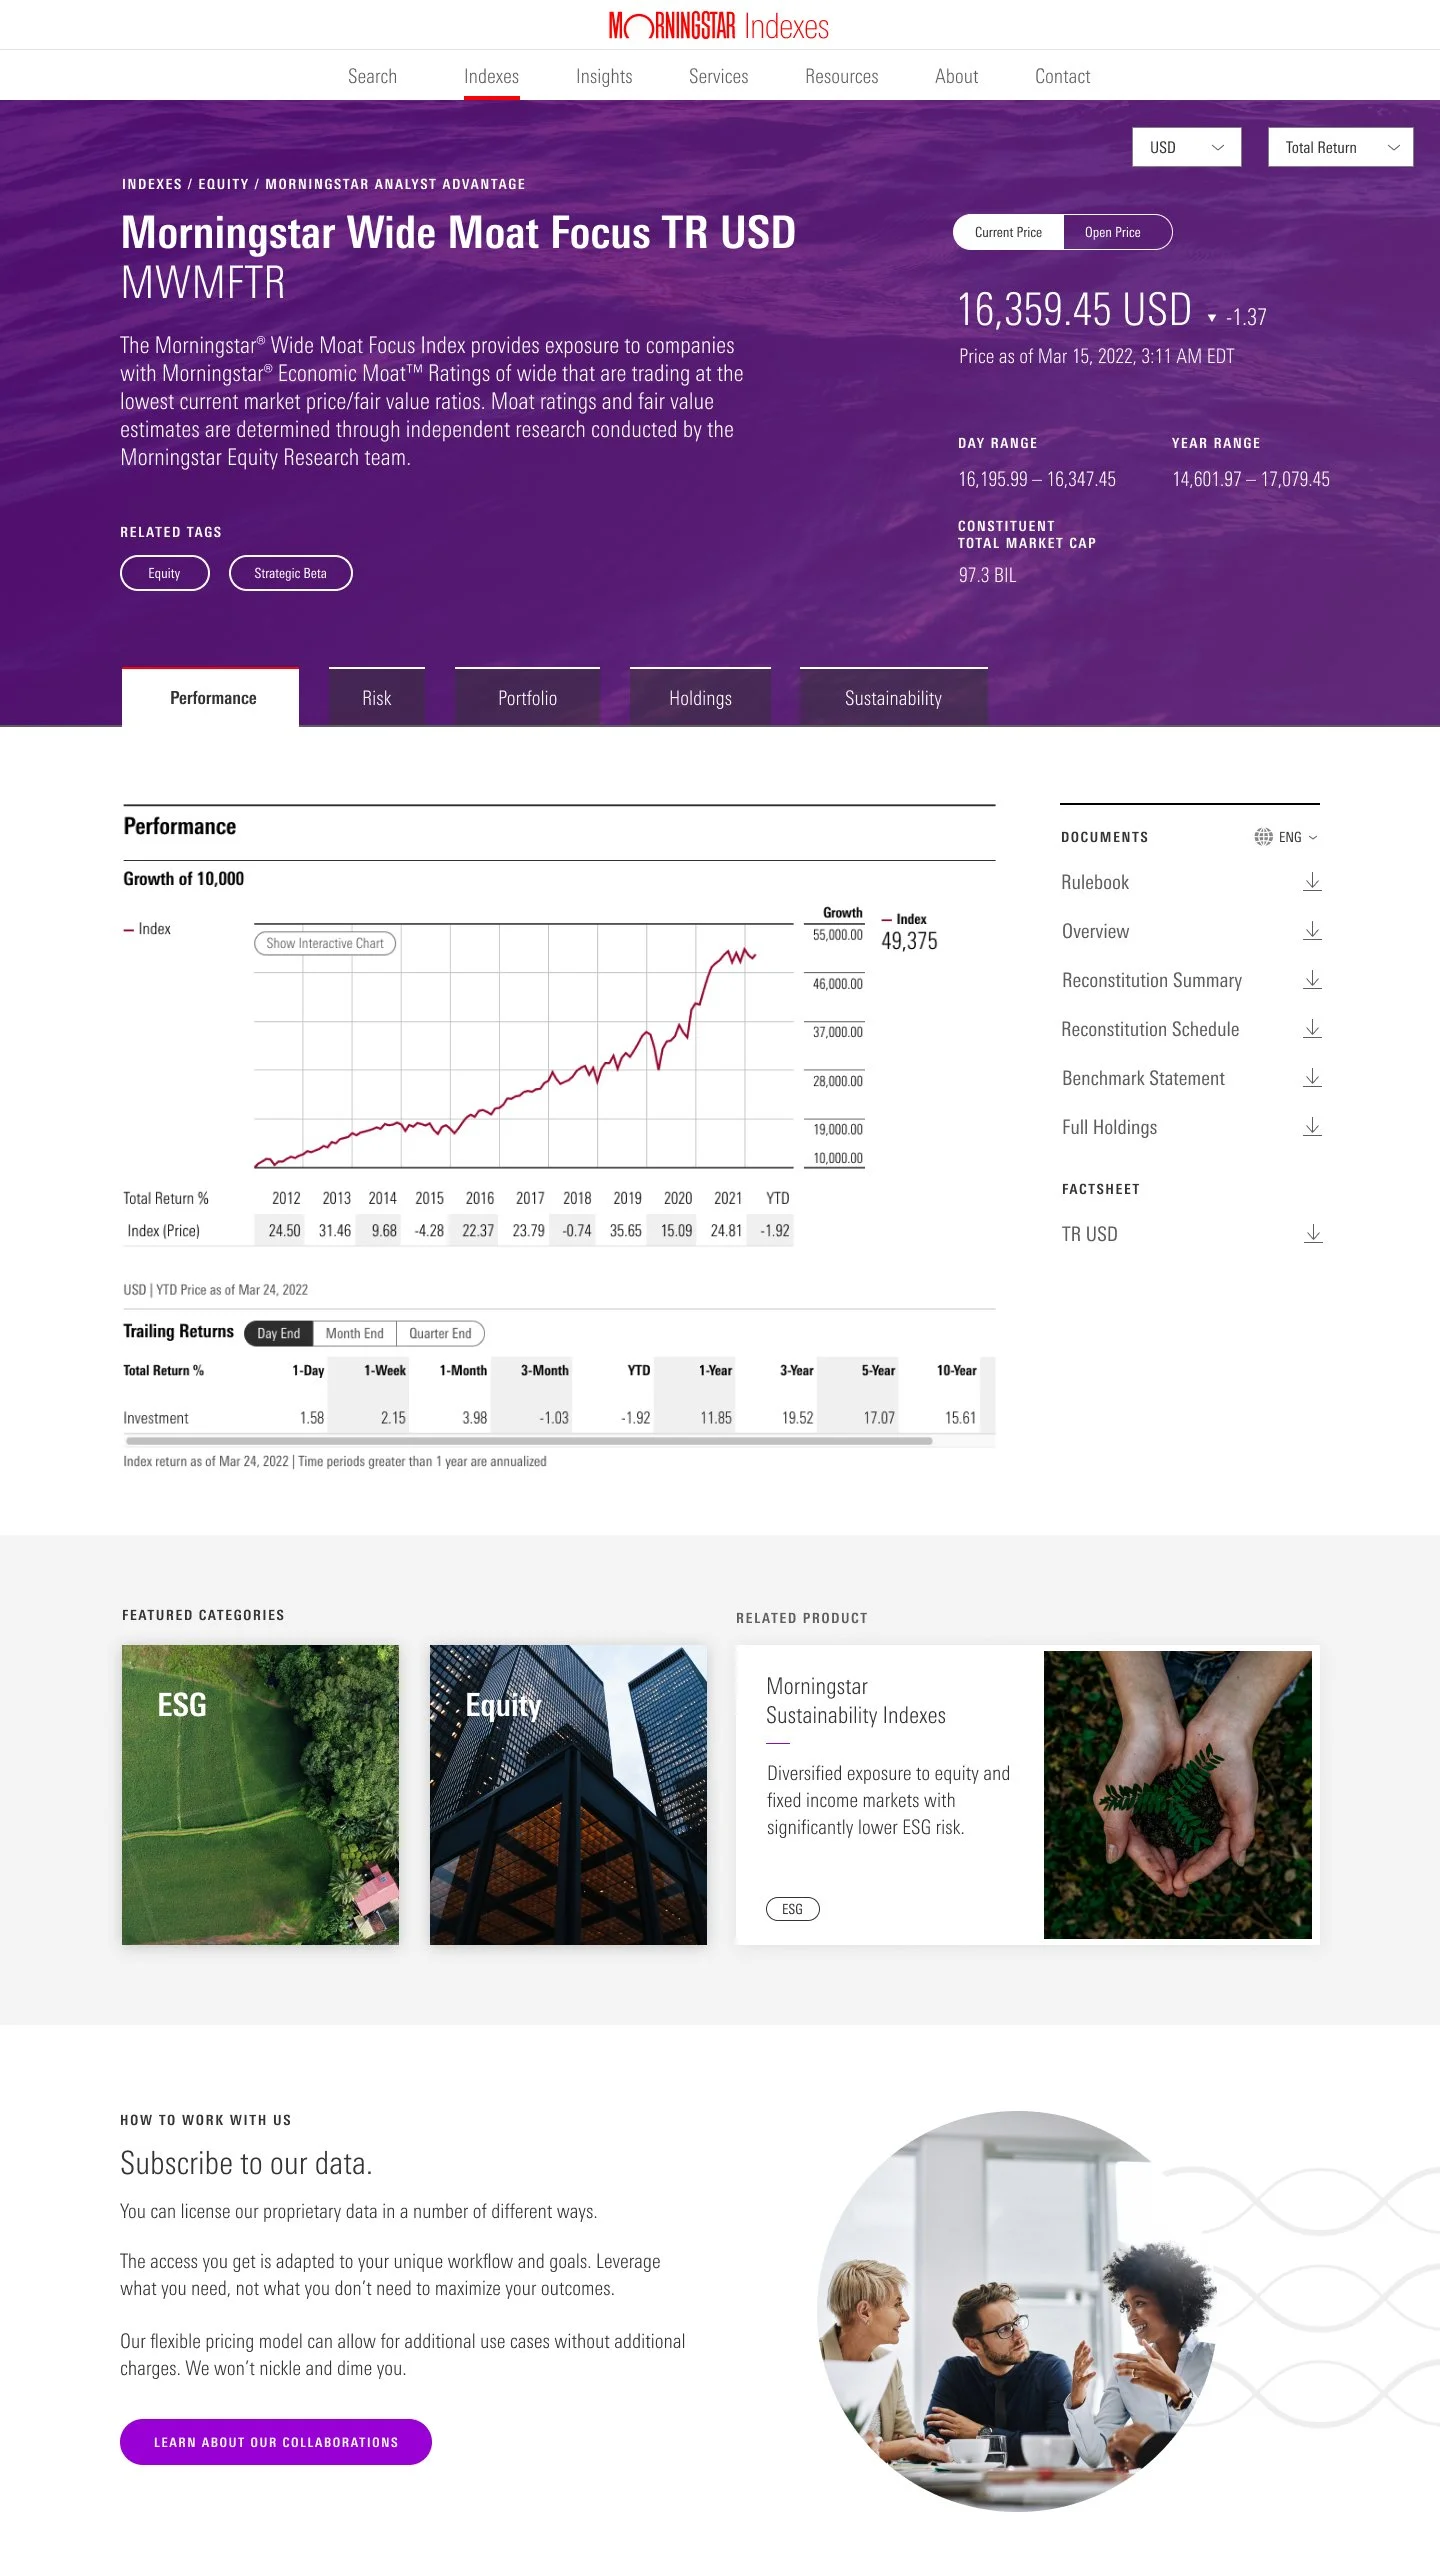
A simplified product interface and improved navigation designed to empower users to quickly identify and understand the data they need for informed decision-making.
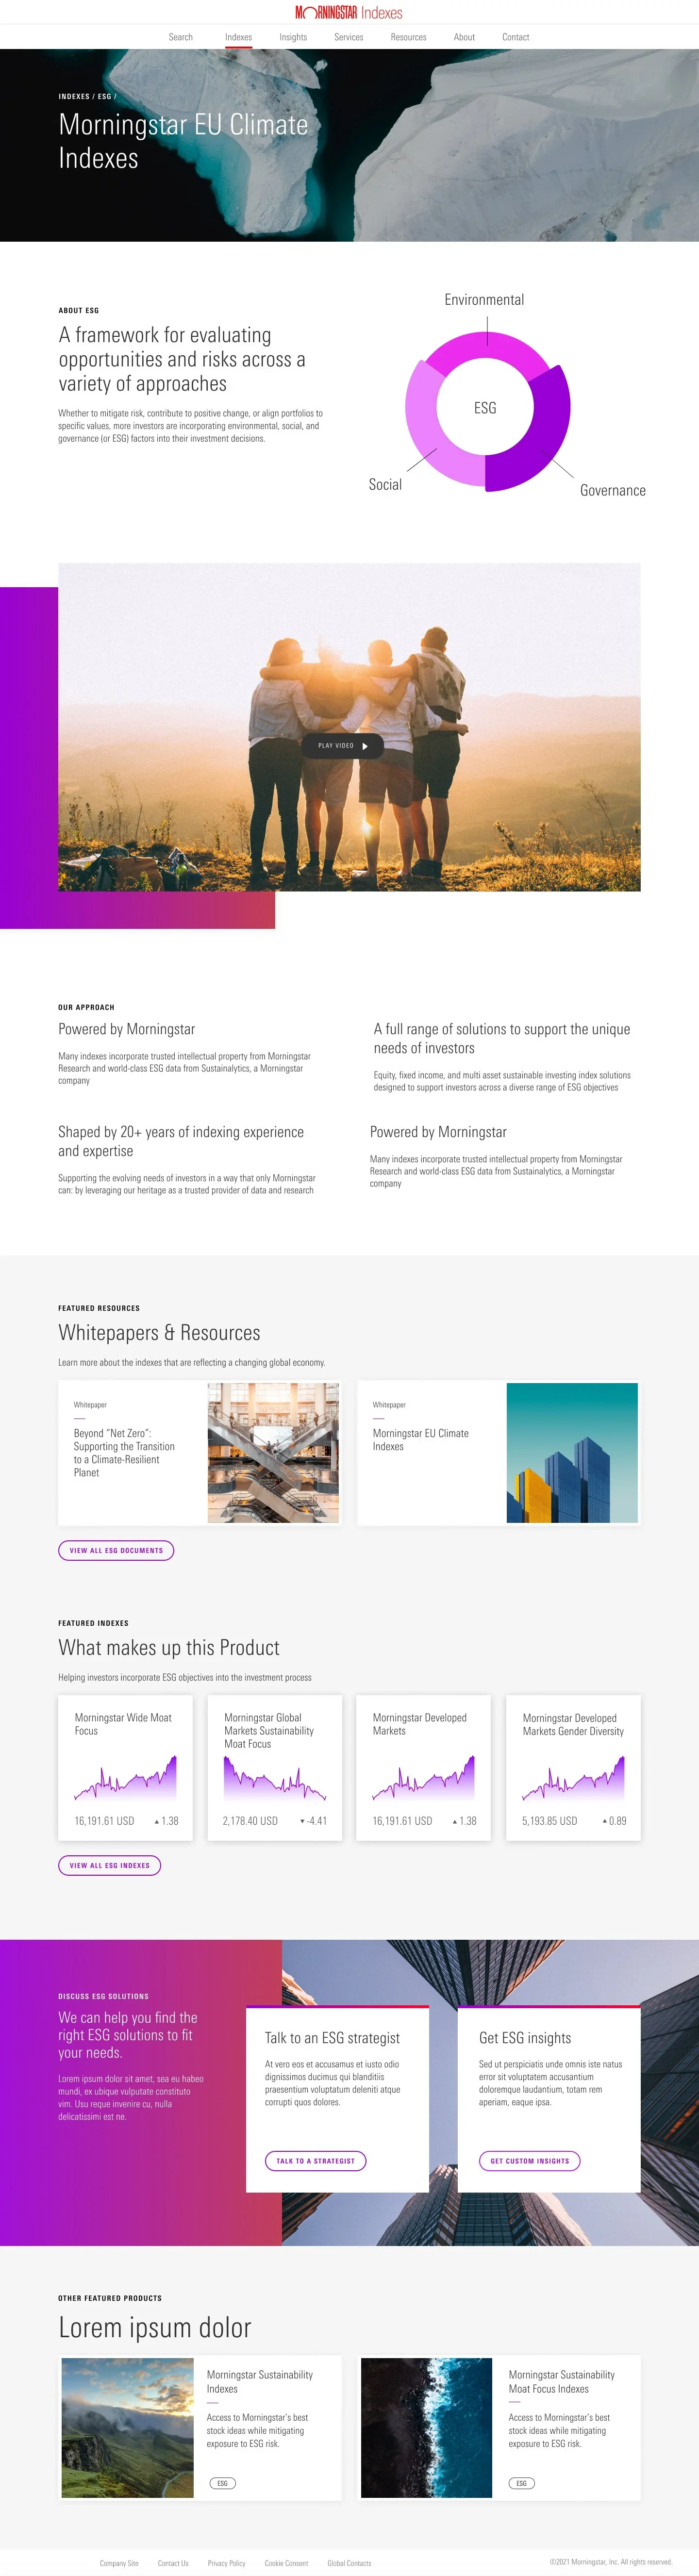
Data Visualization Strategy
We developed a robust framework for complex financial benchmarks, making high-density data easily digestible through interactive line graphs and comparative charts.

My Role
As Principal Experience Architect, I spearheaded the end-to-end UX strategy and design execution, managing a team of visual designers and collaborating with global stakeholders.