
Abilify MyCite System Case Study
Product Strategy / IoT
Otsuka Pharmaceuticals' Abilify MyCite system combines medication with an embedded RFID microchip and an on-body sensor to help patients and healthcare providers (HCPs) manage bipolar disorder and manic depressive disorder. The system transmits data to a patient-facing mobile app and a provider web portal.
Challenge & Opportunity
The initial patient-facing app, developed internally, provided basic medication adherence tracking but lacked key features and suffered from usability issues. User testing revealed that 70% of participants struggled with the five-screen onboarding process, leading to a high drop-off rate. The app also lacked clear visual cues regarding medication intake, causing confusion and potentially impacting adherence. Furthermore, it didn't leverage the sensor's full potential for biometric data collection.
Objective & Solution
The objective was to redesign the patient app and HCP portal to increase user adoption and engagement. Our approach focused on user-centered design, incorporating insights from patient interviews, heuristic evaluations of the existing app, and stakeholder feedback from HCPs.
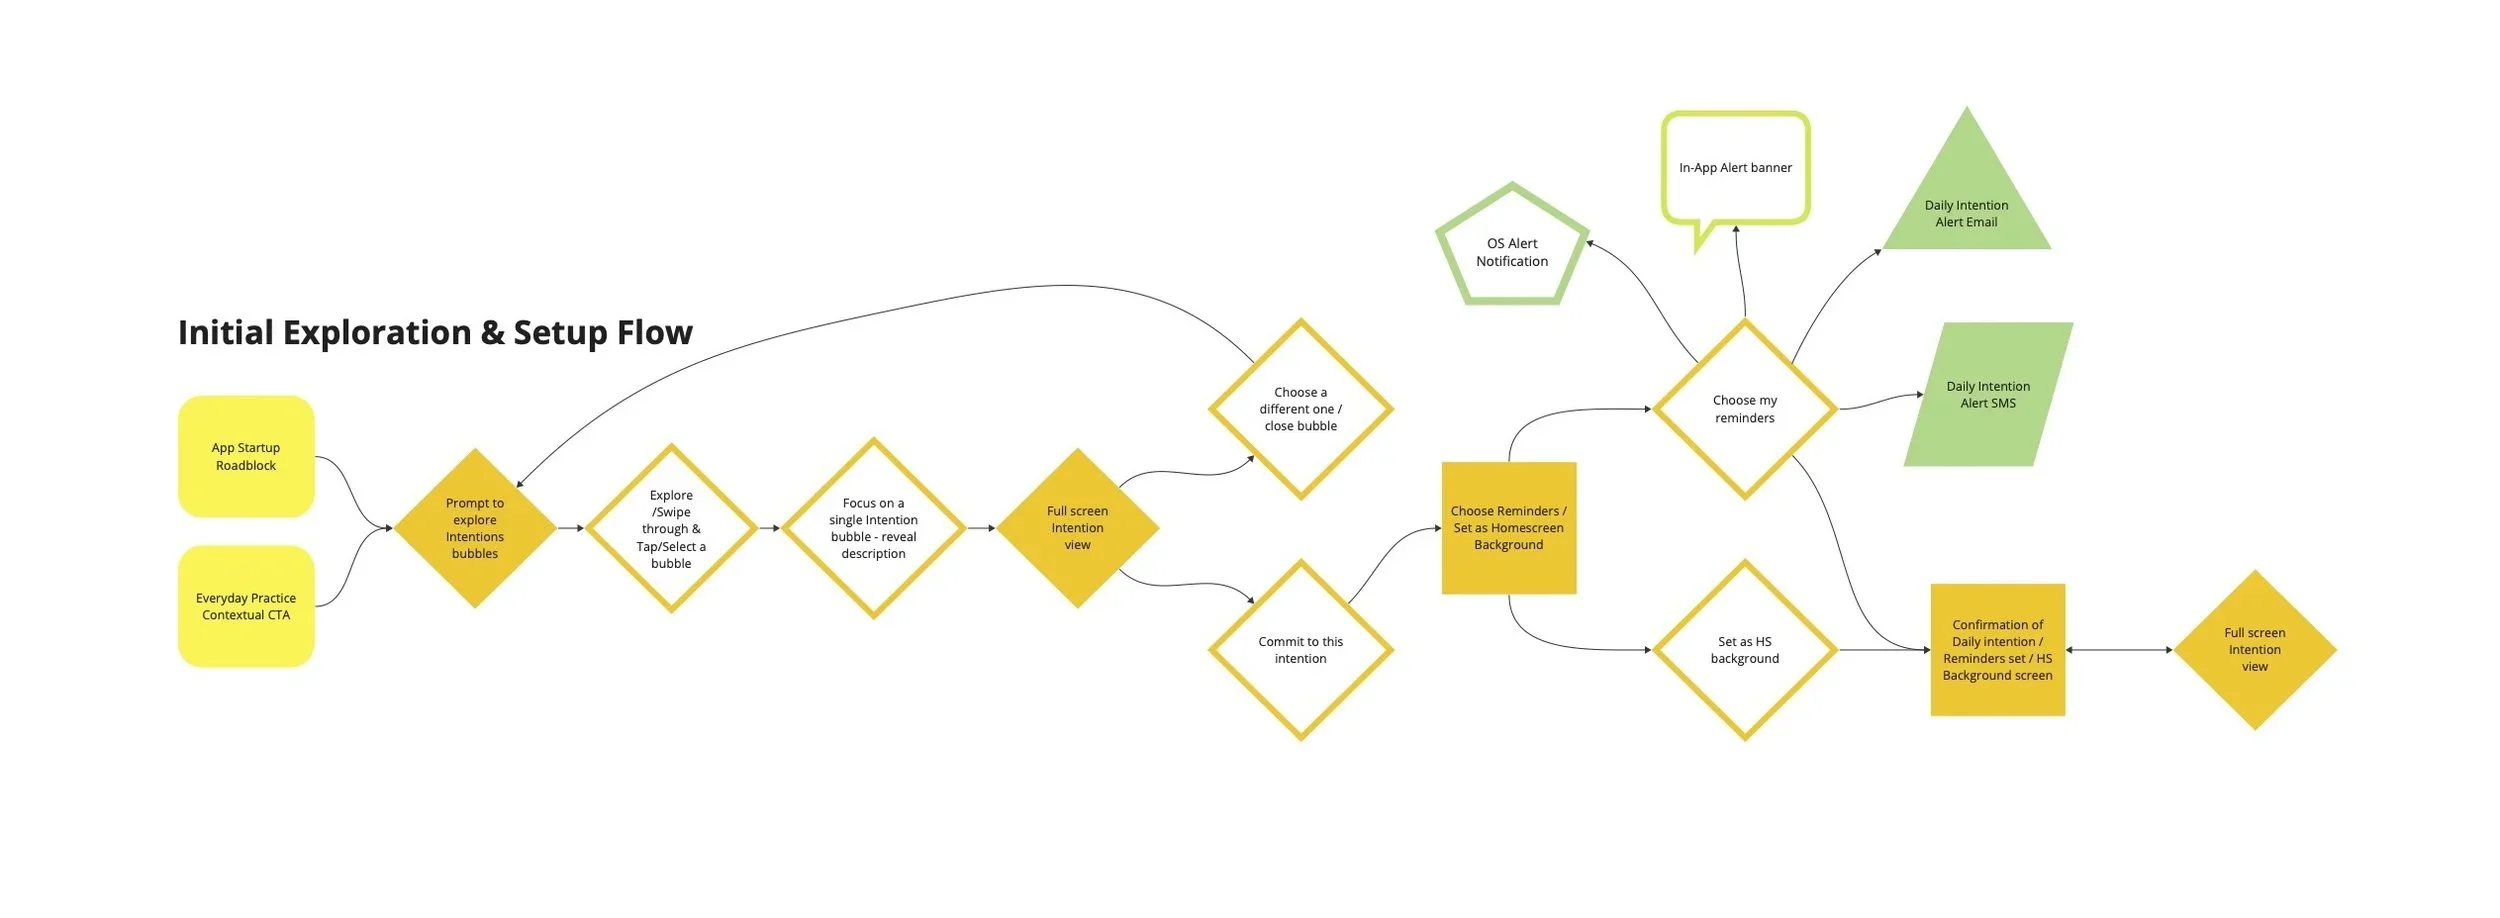
Patient App
Create a more intuitive and engaging way to track medication intake, understand its effects, & receive personalized support.
Enhanced Medication & Status Tracking
We introduced a daily reminder feature to encourage medication and personal status tracking with customizable alerts and visual progress indicators, improving medication adherence by 25% (based on self-reported data).
Gamification for Engagement
We incorporated gamification points and badges tied to adherence, and encouraging and relevant educational content, increasing daily usage by 40%.
60% reduction in onboarding time
Replaced multi-screen process with step-by-step tutorial – clear visuals and interactive elements
Increased daily usage by 40%
Incorporated gamification elements – points and badges – tied to medication adherence and educational content about bipolar disorder
25% improvement of adherence
Introduced daily medication reminder feature with customizable alerts and visual progress indicators
Real-time insights into impact
Integrated sensor data to provide patients with personalized insights into the impact of medication on their activity levels and sleep patterns
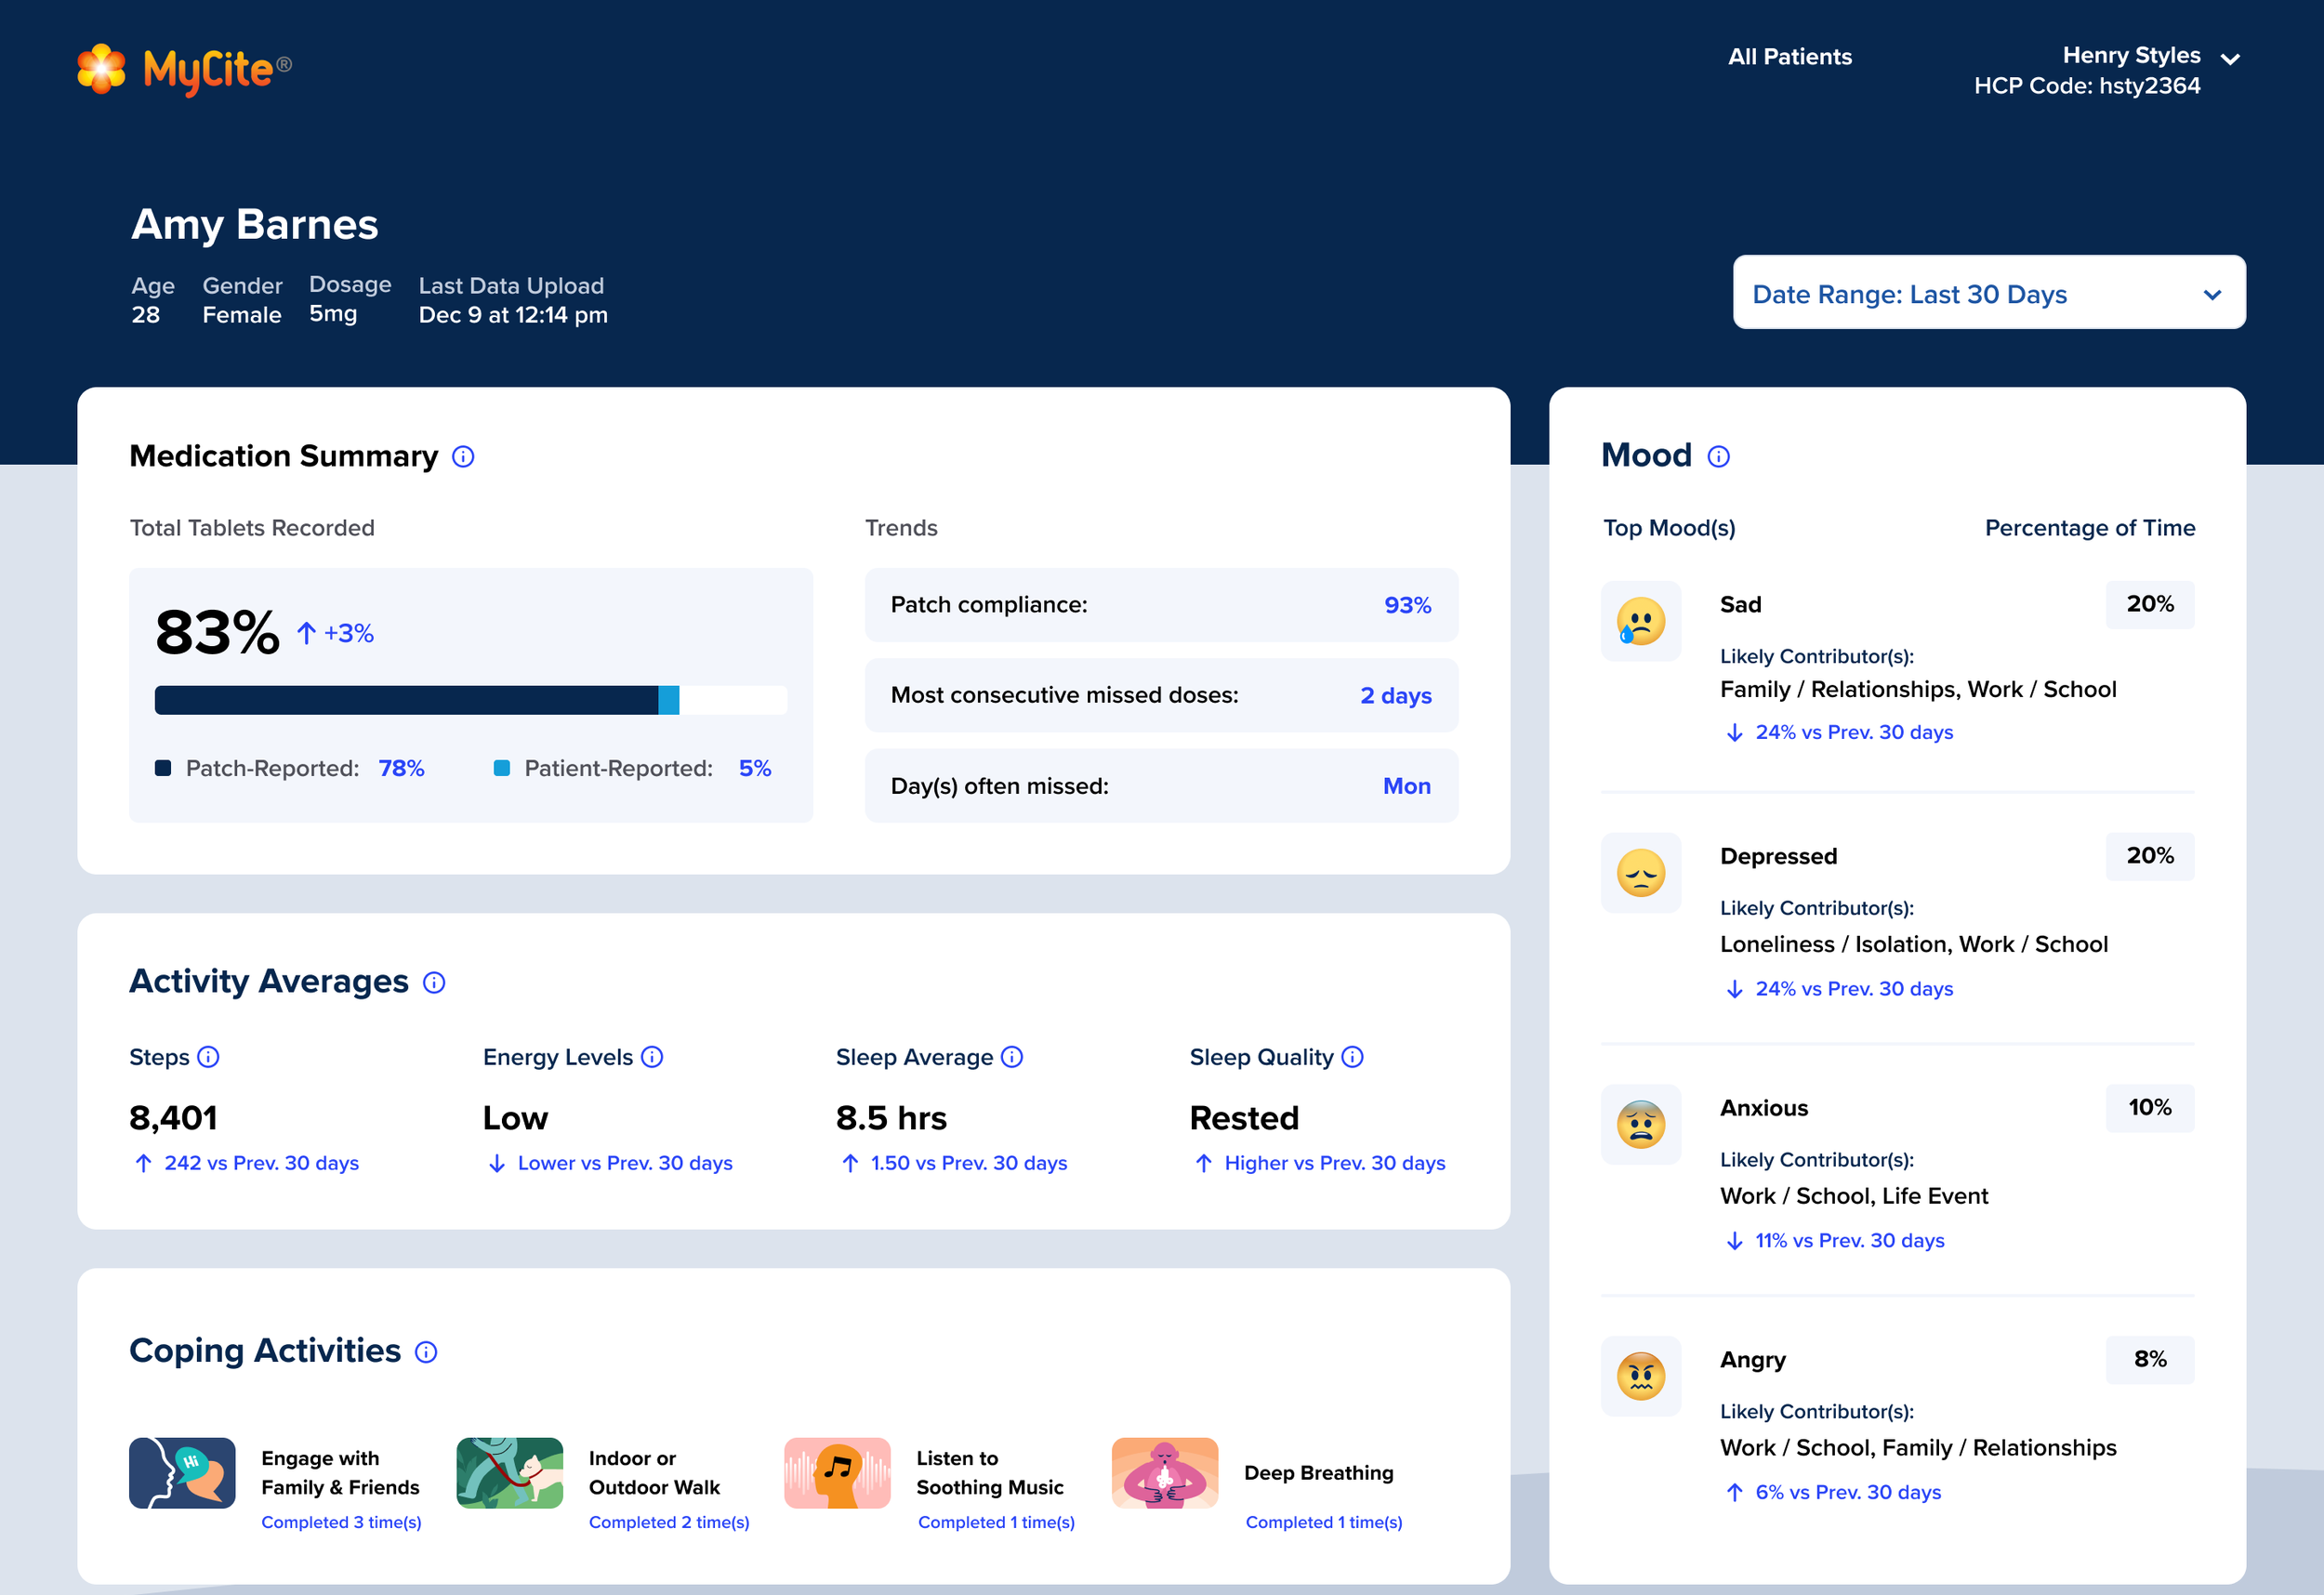
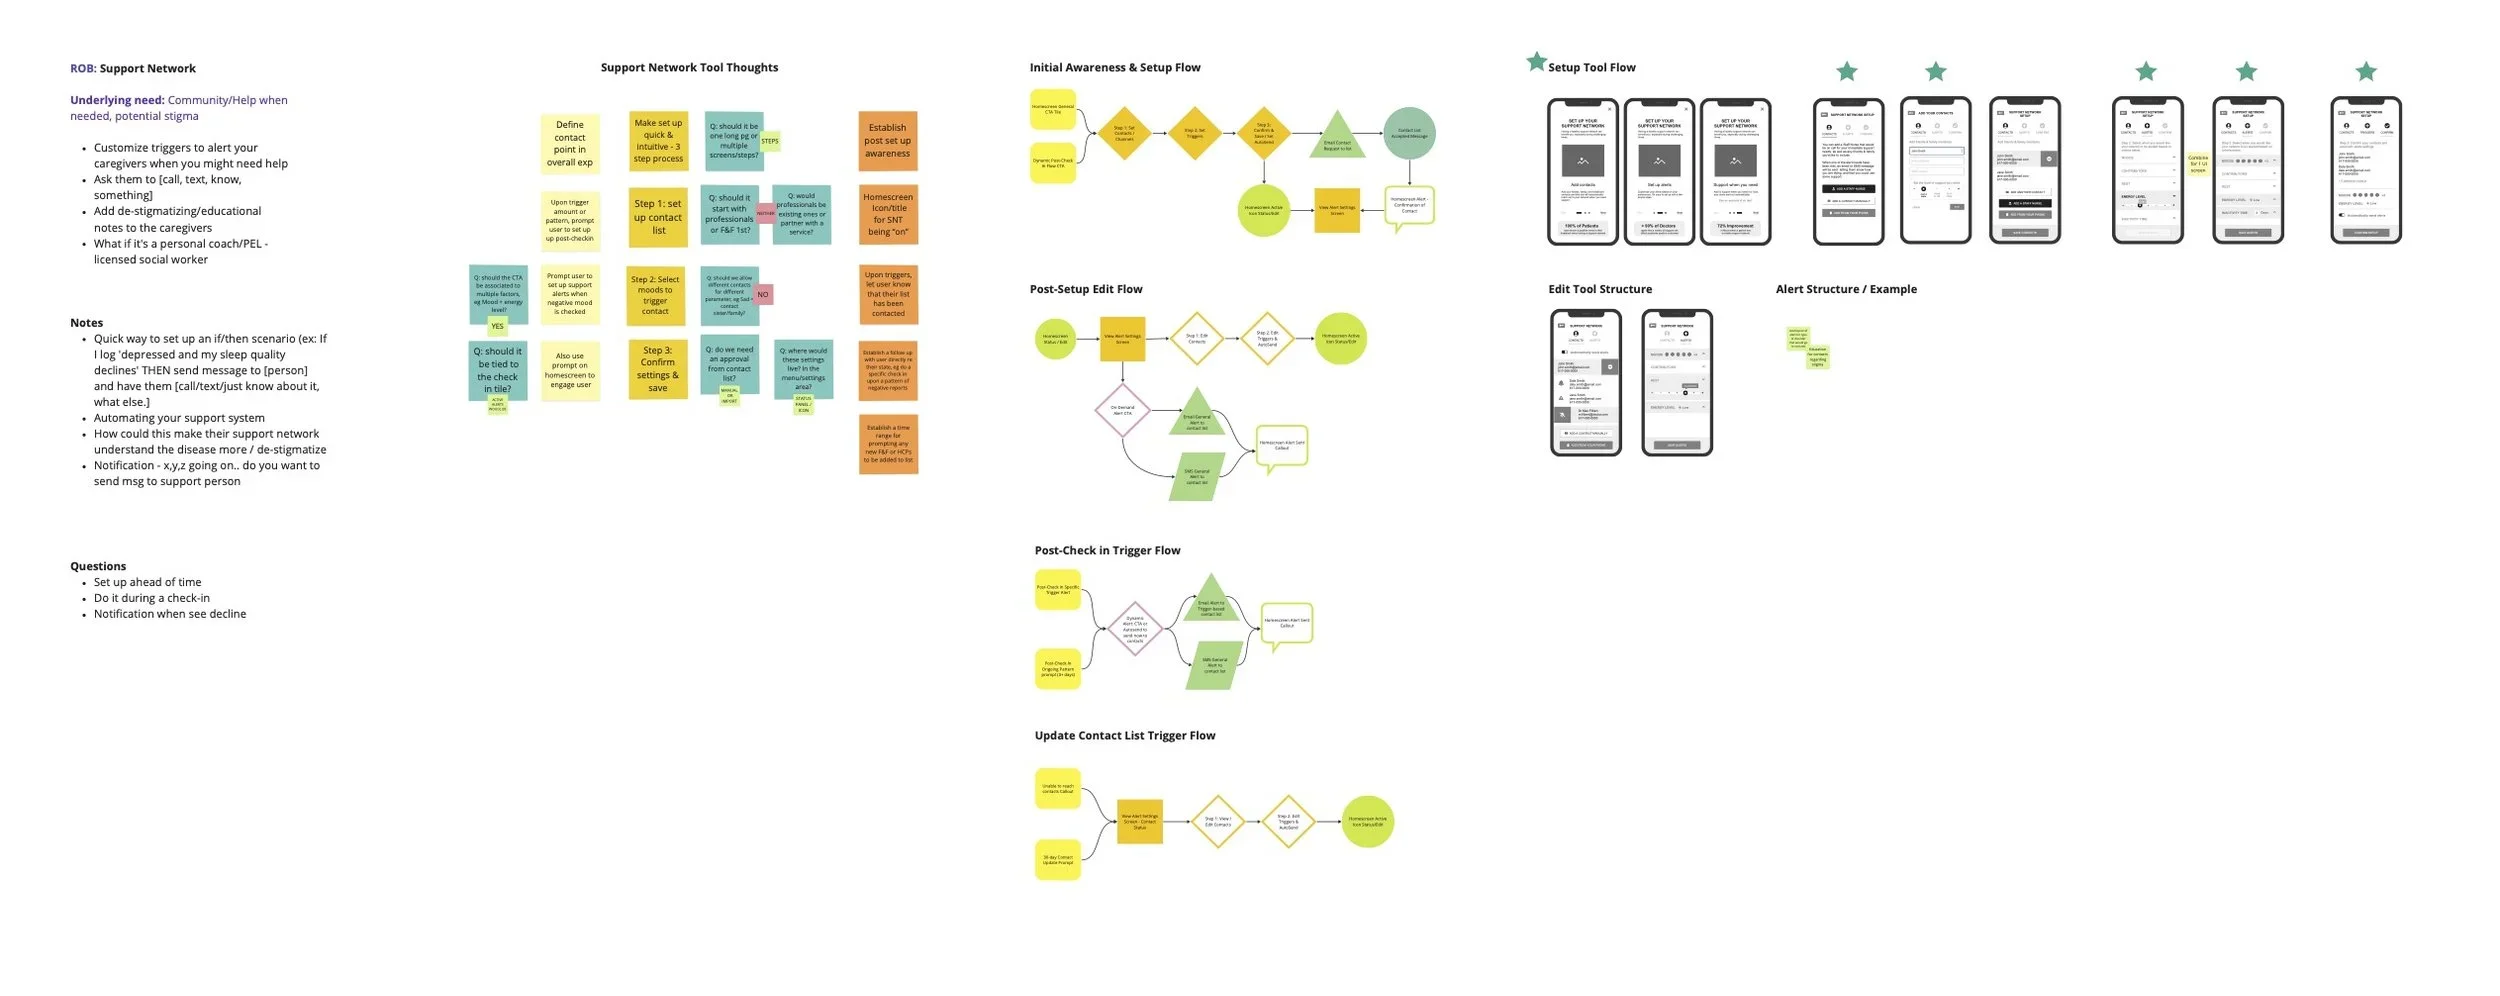
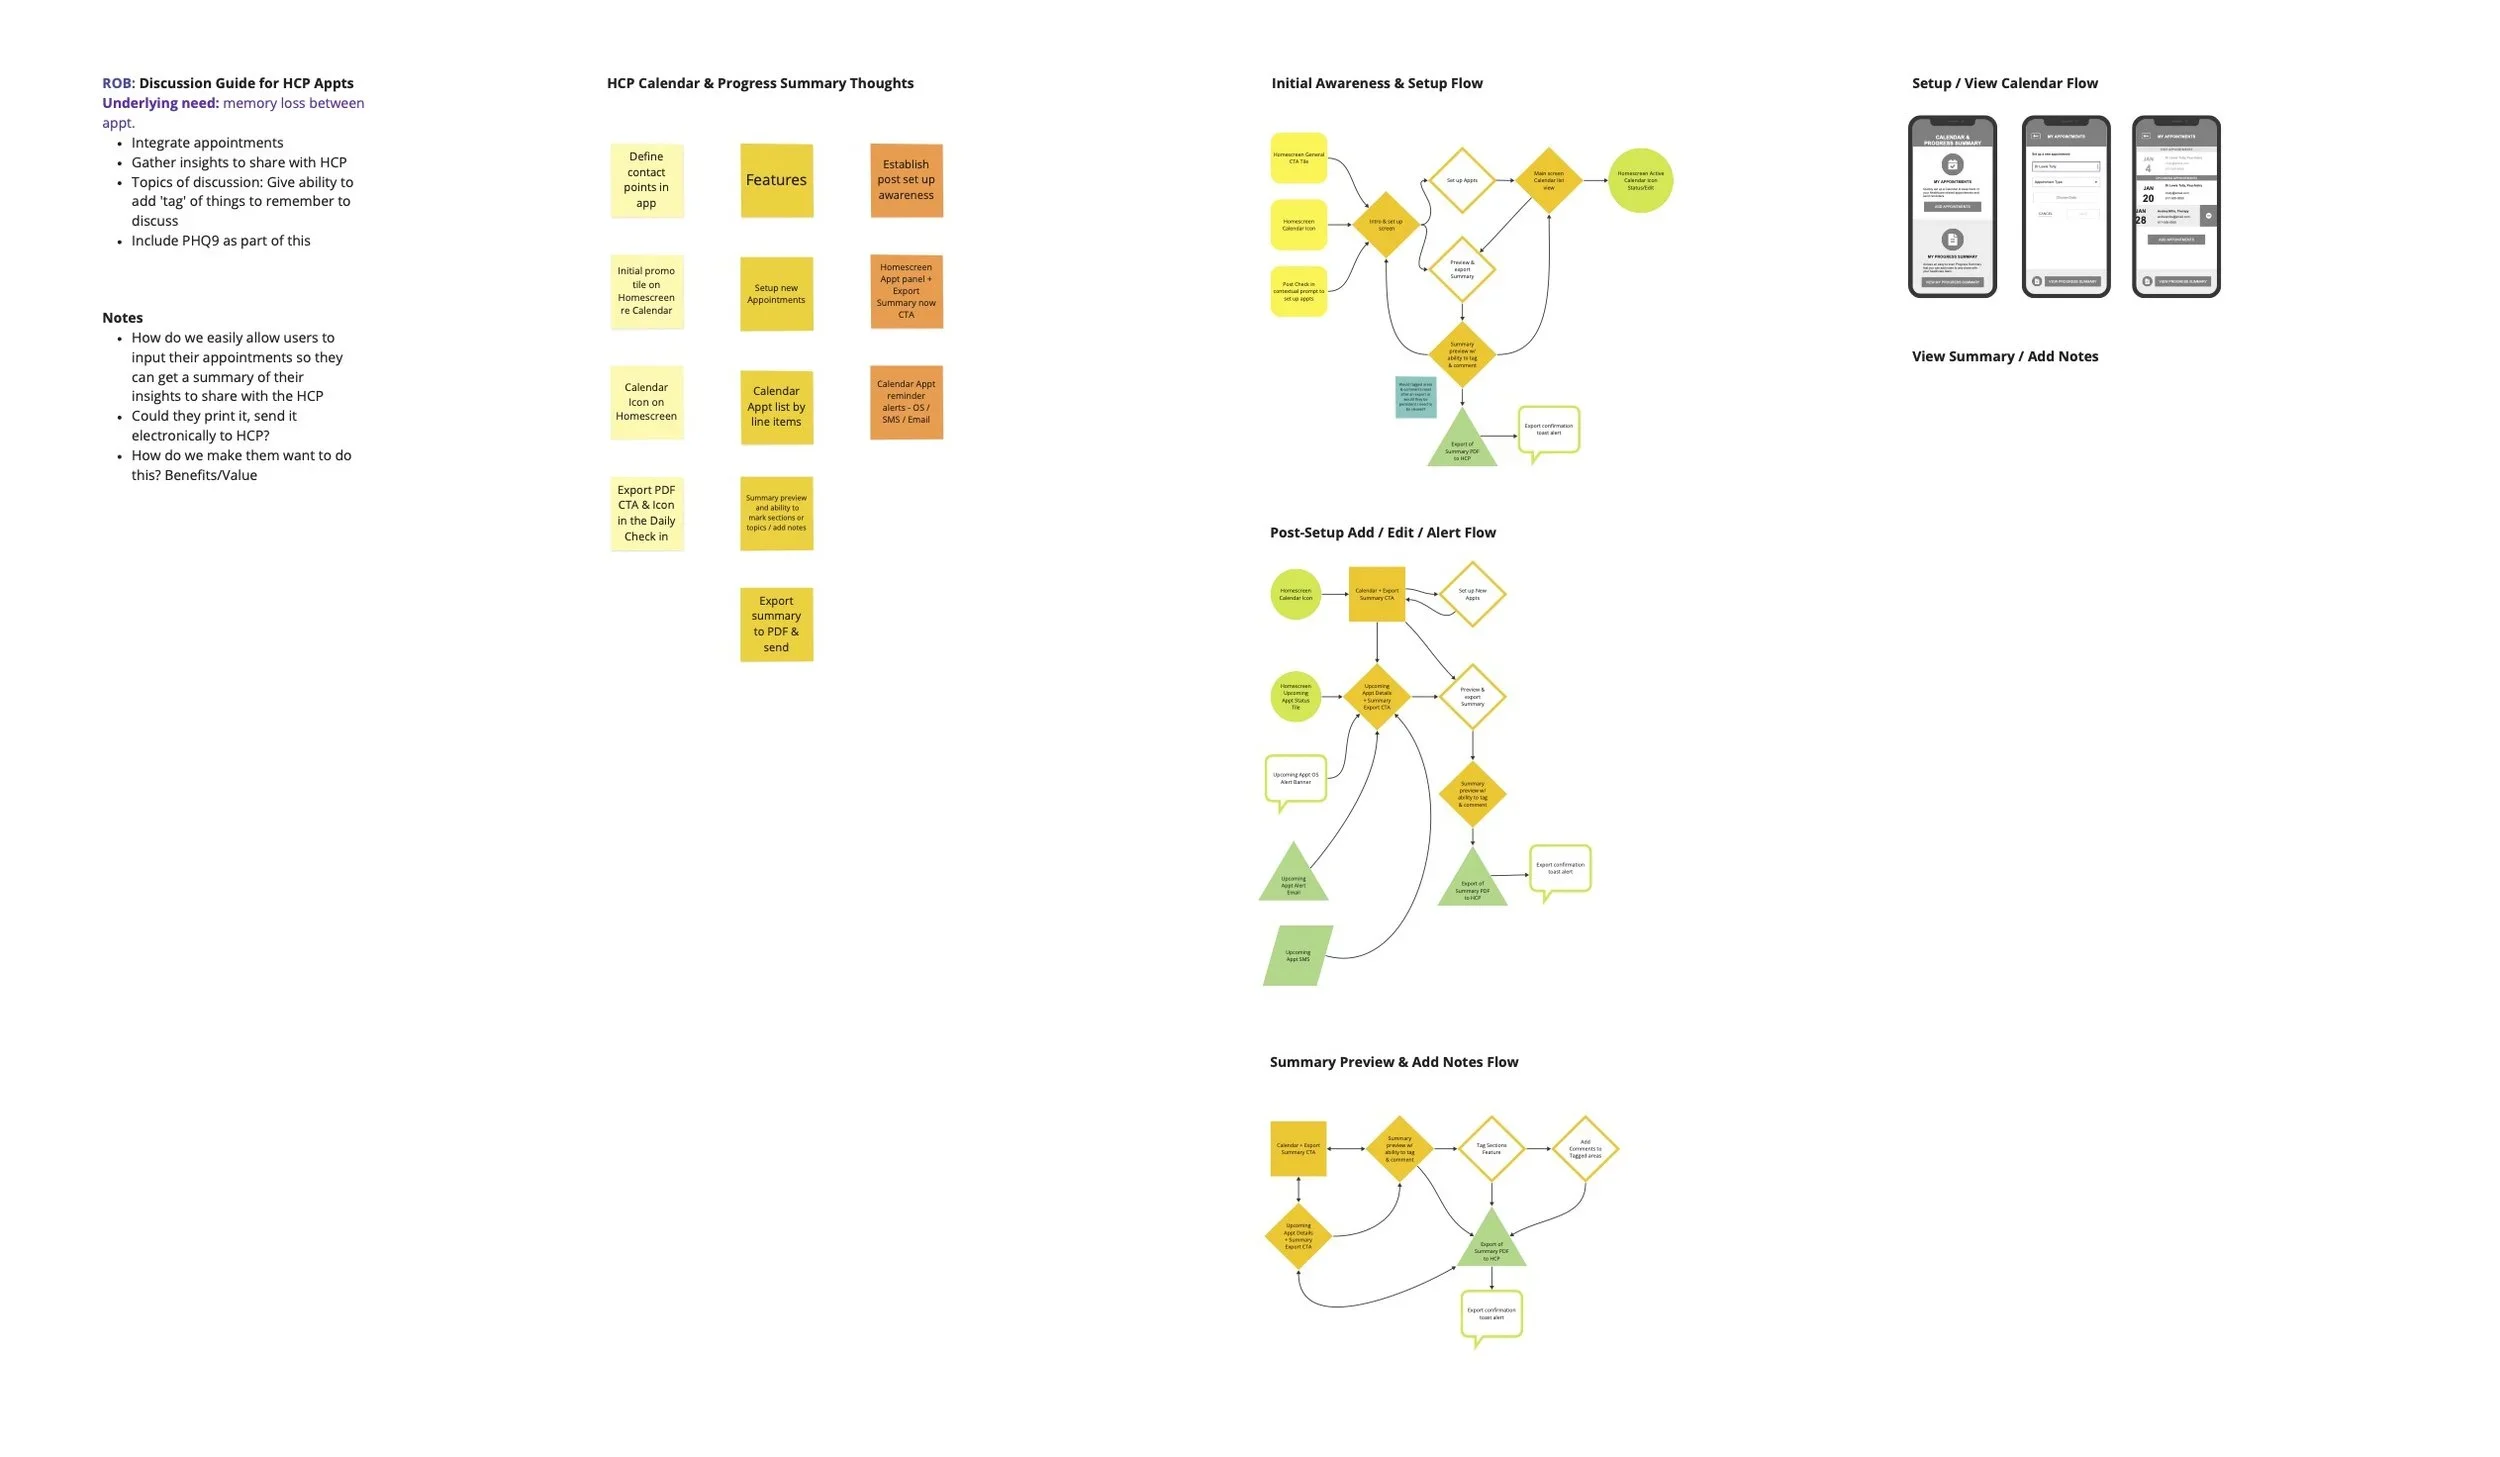
Provider Portal
A more comprehensive and customizable view of patient progress, including data visualizations and summarized reports, to facilitate informed treatment decisions.
Data Visualization
We employed clear and intuitive data visualizations (e.g., line graphs, bar charts) to help HCPs quickly identify patterns and trends in patient data.
Summarized Patient Reports
We implemented automated patient reports summarizing key trends and potential areas of concern, saving HCPs valuable time and facilitating more efficient patient consultations.
My Role
As Principal Experience Architect, I led the UX and UI design for both the patient app and HCP portal, managing a team of four UX designers and two UI designers.